Rather than having to dig into the reporting categories, you can access data instantly, saving time and making campaign set up and optimisation a breeze. Custom reports do not reinvent the wheel, the data is already held within GA; what they do is help pull out what’s important to you, and give a quick summary to help drive decisions for your PPC campaigns.
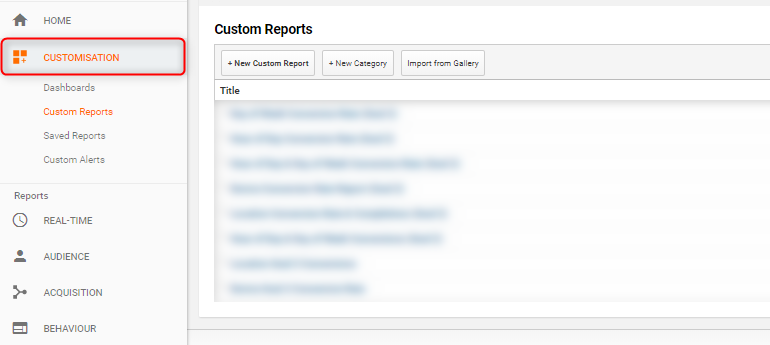
Custom reports can be found in the customisation tab on the left-hand side of GA:
Custom reports are useful for all digital disciplines; SEO, link building, PR, email marketing and more; however, this post looks specifically at PPC. As an agency, we use custom reports for every single paid account we work on. From day one, we implement custom reports to help drive insights into our paid campaigns to get the best possible results for our clients.
In the past year, we have worked with over 200 paid media accounts and managed over £4 million in ad spend, and we use many complex custom reports which we have built over time. However, these are our top six that we use as standard to help you get started:
Device Conversion Rate
Whether you are setting up new campaigns or optimising an existing one, having a quick conversion rate by device report will allow you to implement the relevant bid adjustments for your campaign without having to dig into GA. This top-level report looks like this:
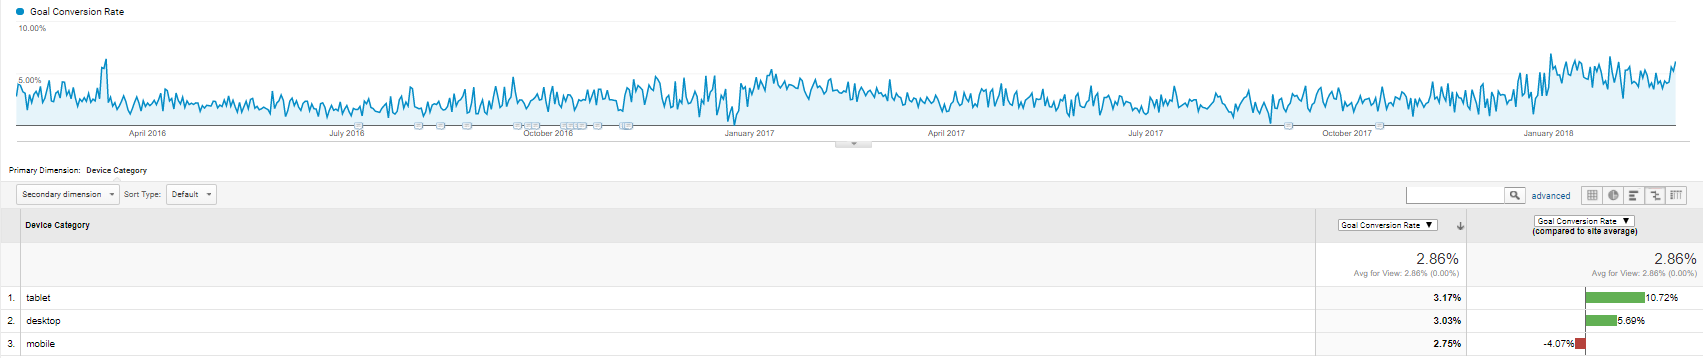
When setting a new account up with no prior data, you can look at the overall conversion rates. If you want to look at just PPC, then segment the data by paid and you’re good to go. Top tip here is to view the data as a comparison, rather than the standard data view:

This will allow you to view the device conversion rate in comparison to the site average, making it easier to understand and taking the hard work of figuring out device bid adjustments away.
Want to check it out? Click here to add a device conversion rate report to your GA.
Demographic Conversion Rates
Gender and age conversion rates can be really useful in optimising PPC accounts, as this top-level data can feed into your search and display campaigns for both bid adjustments and targeting. The report will look like this:
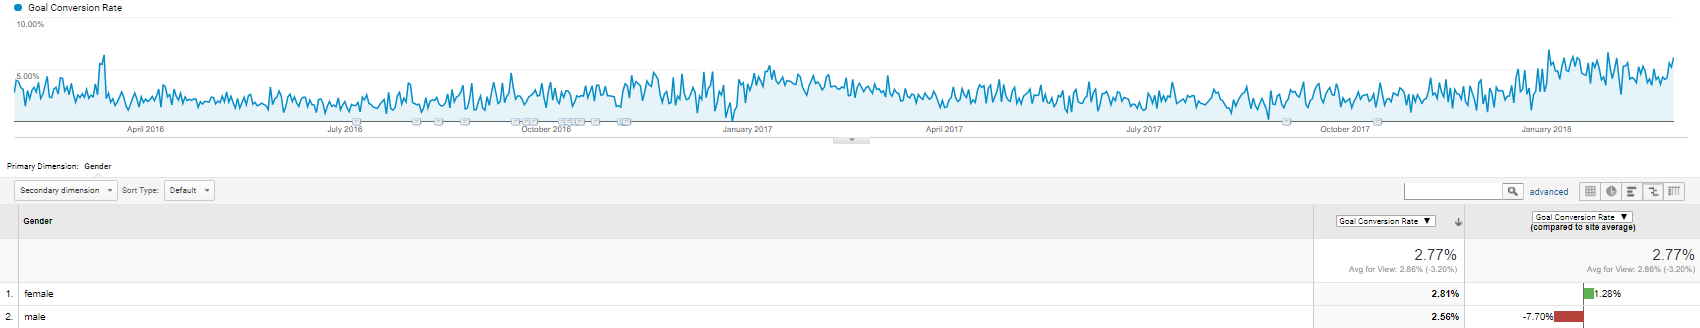
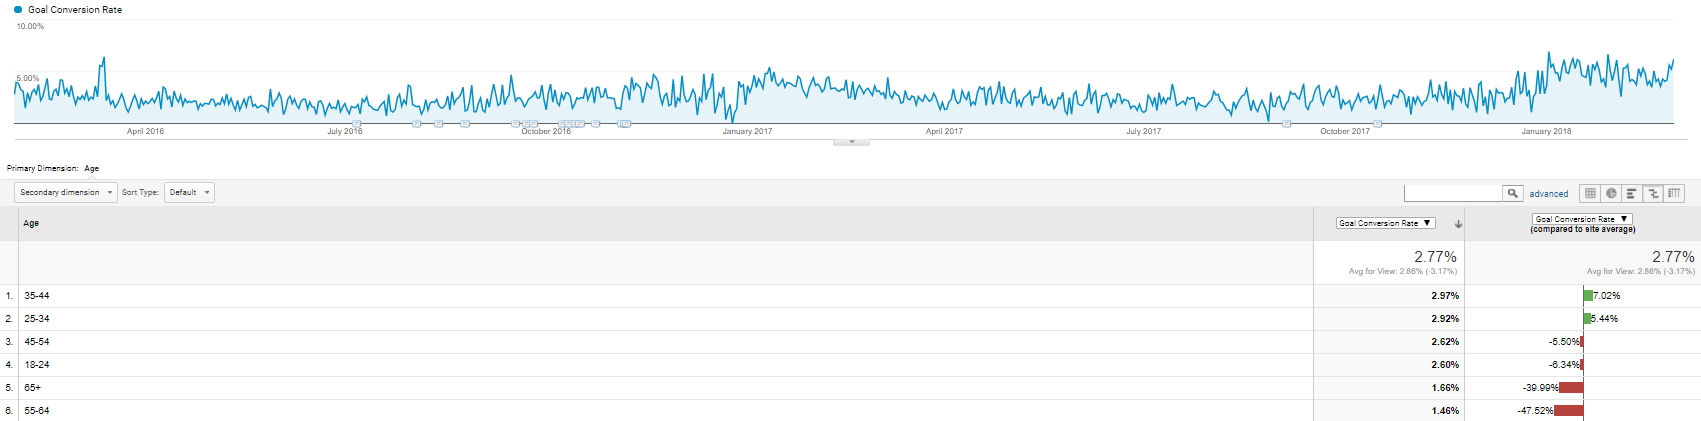
Useful for both new accounts and established campaigns, this report will show you which gender converts the best – segment this by paid, change the dimension from goal conversion rate to a specific goal… go crazy! The same applies to age conversion rates, which looks like this:
Top tip here is to look at goal completions as well as conversion rate, to avoid basing your adjustments and observations off conversion rate alone. With the example above, we would assume that males and females are not too dissimilar with regards to the rate in which they convert, leading us to have fairly flat bid adjustments. The goal completions however, tell a different story:
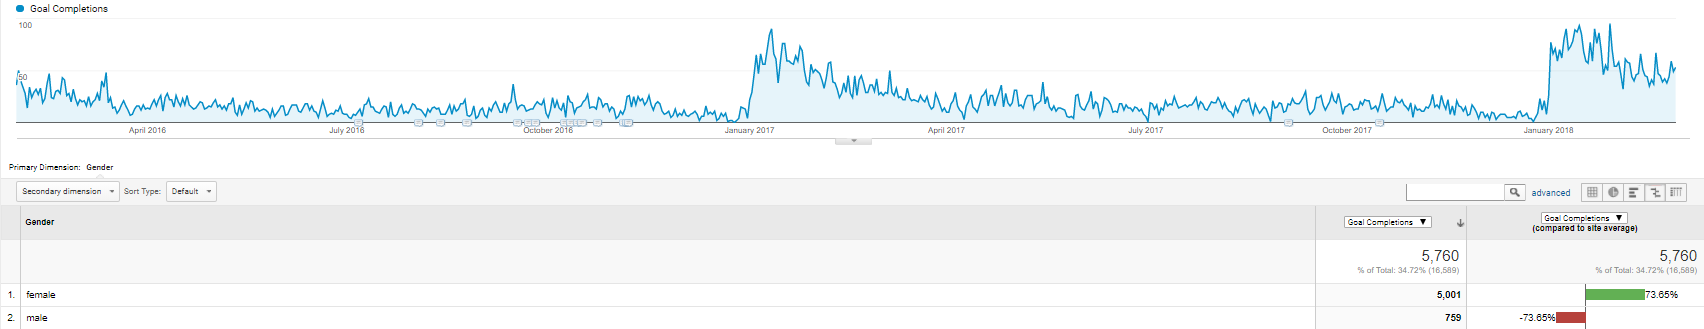
Look at both, edit your custom reports and have a play around – look at different conversions, segment the data by channel and get a true understanding of the traffic demographics before jumping into your AdWords/Bing account to make the adjustments.
Ready to go? Click here to add the custom gender report and click here to add the custom age report.
Goal Completions by Location
Goal completions isolated by the city, country, continent and region are handy when setting up new campaigns on AdWords/Bing, as you can see the locations where users are converting the most. We would avoid using conversion rate here, as a small town may have contributed to two clicks on your website, but one of the clicks may lead to a conversion. Putting this location at the top of the list leads you to make assumptions that may not be true. Goal completions are the way to go, here is a look using cities:
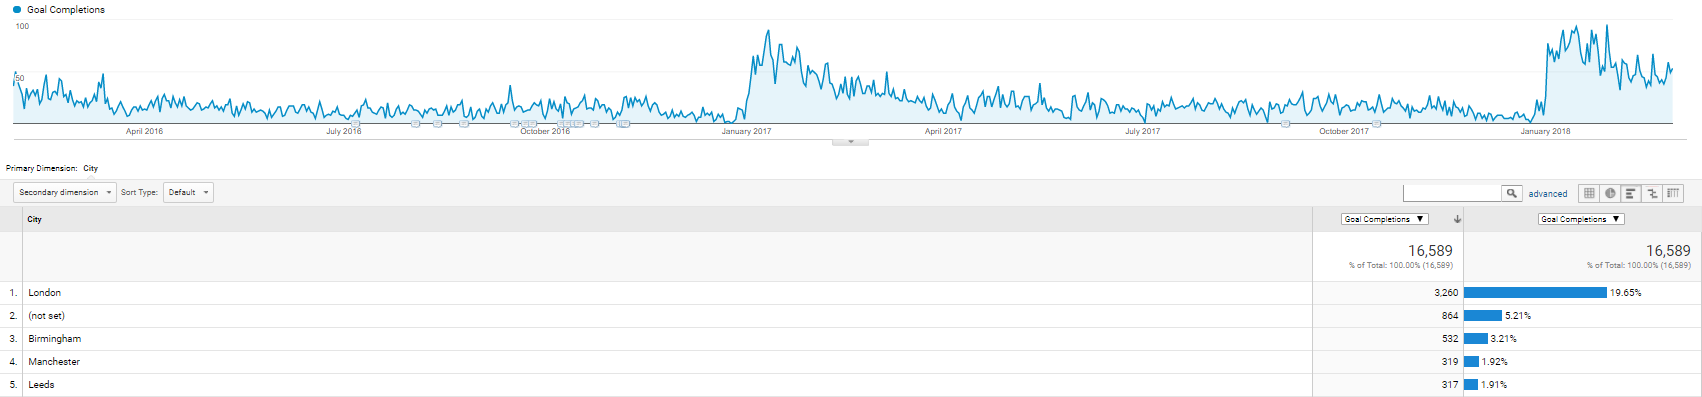
To filter the data by country or region, head into the edit feature and update the dimension metric – it’s that simple. Want to get more granular? Layer up additional dimensions such as search queries – useful for location-specific campaigns where users may be searching for services in a different city, such as an events company.
Click here to add the goal completions by city custom report.
Day of Week & Time of Day Conversions
Ad scheduling/day parting is key for all paid campaigns, whether it’s search or display on Google or Bing – you will want to have control over when your ads show and adjust your bids for top performing periods. The following custom report breaks down each day, with a further dimension looking at hourly conversions:
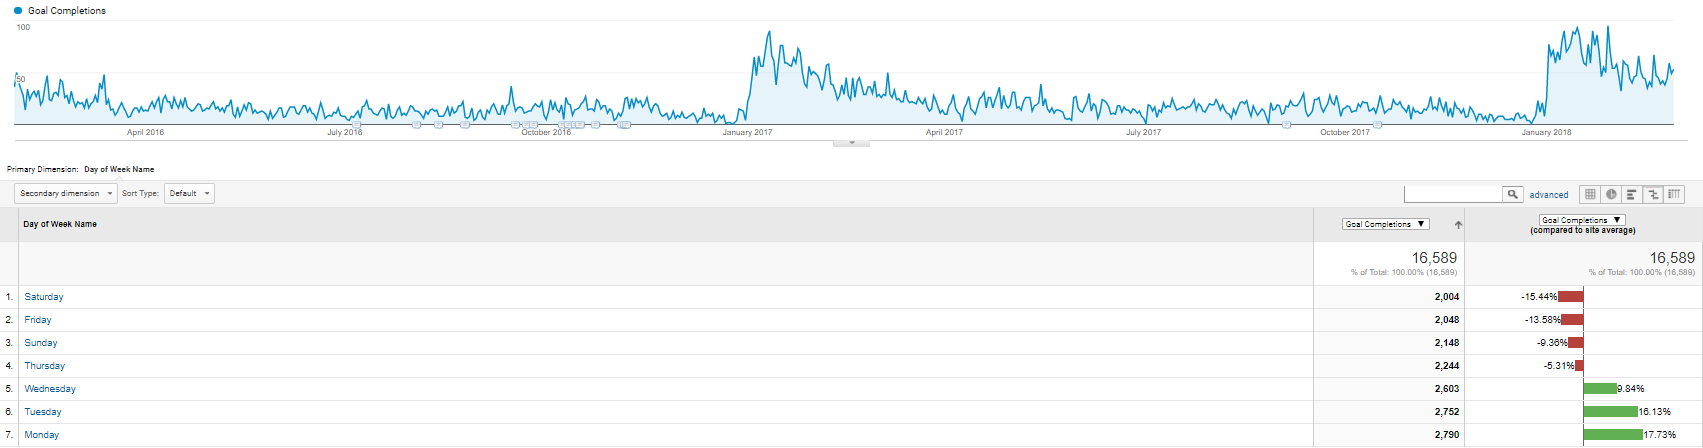
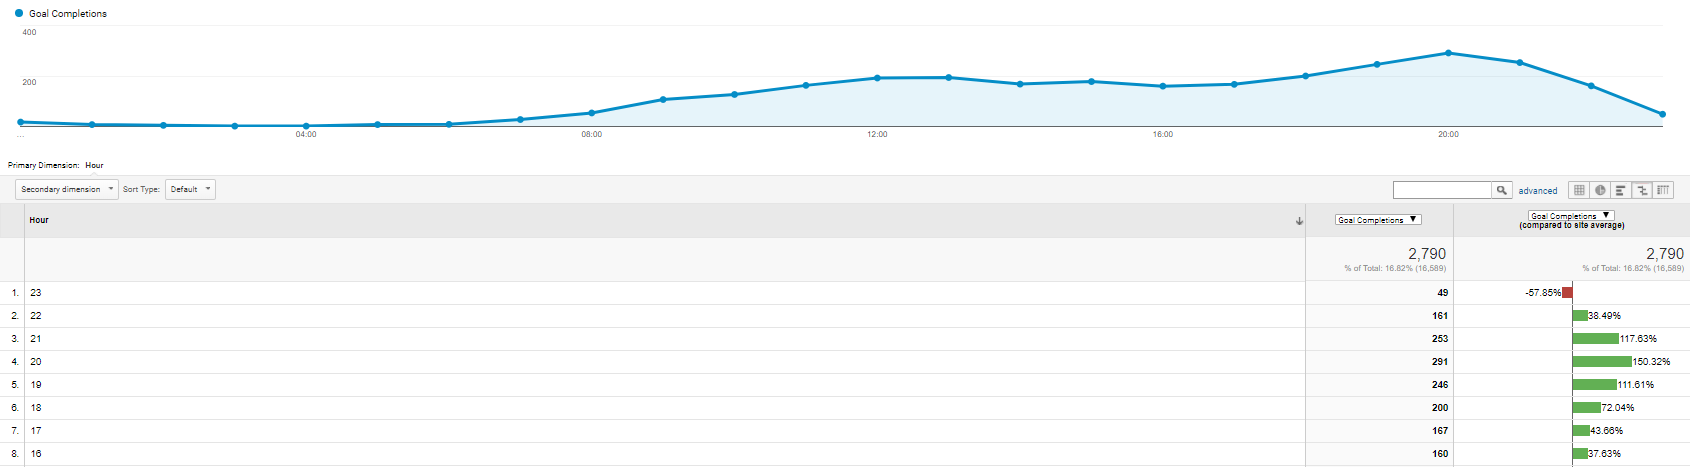
This will give you visibility of hourly conversion data on a day-to-day basis, which you can feed into your PPC accounts. AdWords and Bing allow only six daily segments, which is rather annoying – however, using the above report you can create segments each day where you want to show your ads and where to adjust your bids. You may find that late night/early morning are poor, lunchtimes are strong and spot some interesting trends that will help you drive up conversions.
Click here to add the day of week and hour of day goal completion report.
Paid Landing Page Performance
You can bring basic GA data into the AdWords interface such as session duration and bounce rate. The following landing page report looks a little deeper into user behaviour – allowing you to spot the landing pages that are under-performing and ones that are flying. The report looks like this:
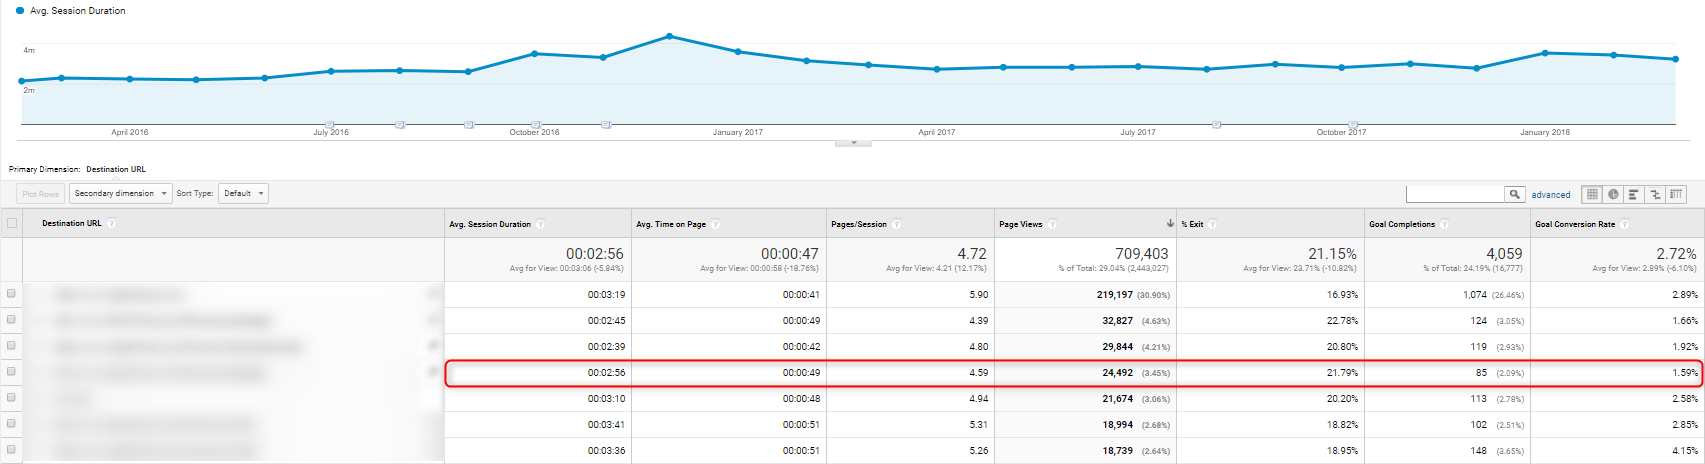
This report is great for spotting areas to improve upon. In the example above, we can see that a great deal of traffic has been driven to that specific landing page; however, the conversion rate is 40% lower than the site average. From here we can evaluate all ads using this landing page and review the content, keyword relevancy, ad copy etc to discover why this is so low and take action.
Ready to sort your paid landing pages out? Click here to add this report to GA.
Campaign/Ad Group/Keyword ROI Report
This report is perfect for pulling your ROI and ROAS together in one neat report, and you can filter this by ad network, campaign, ad group and keyword to analyse performance in as much detail as required. At the campaign level, the report will look like this:
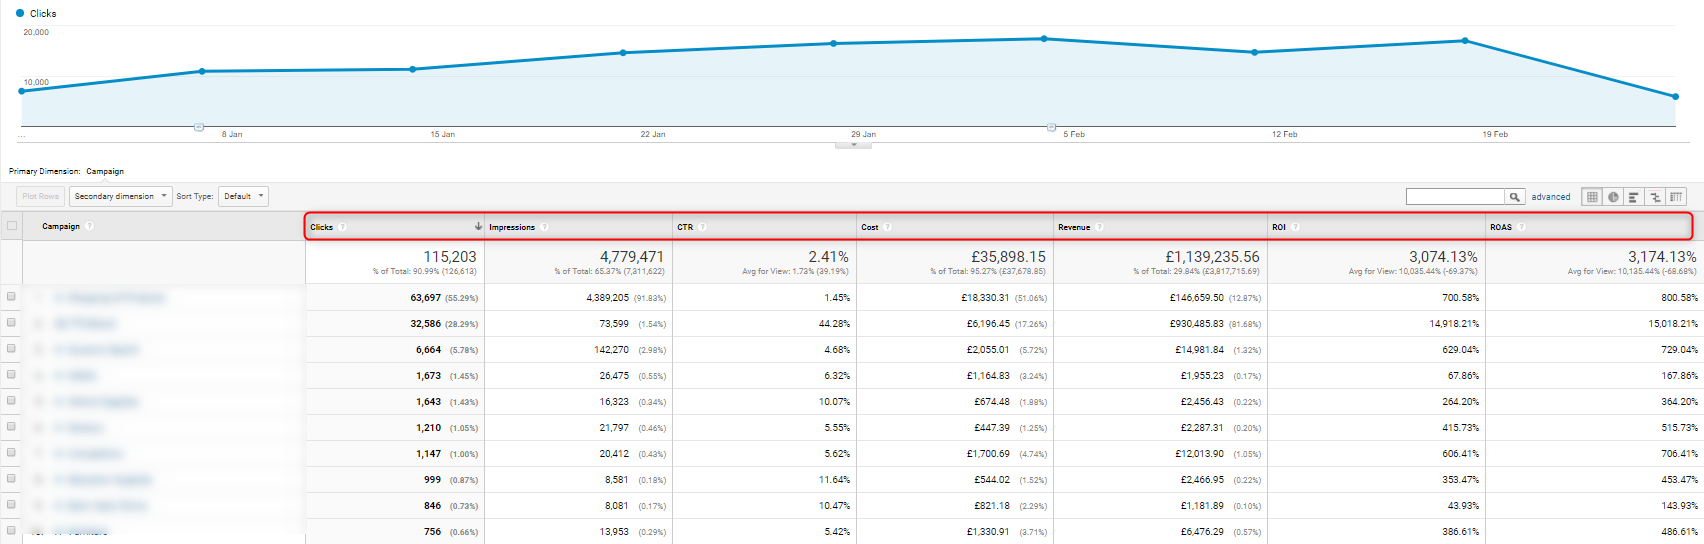
Taking an ROI/ROAS approach to PPC is a must, and this report is a great starting point to review performance. You could further layer this report up with behavioural metrics to spot additional areas for improvement or correlations between data such as average session duration and ROAS – it’s completely up to you.
Click here to get your ROAS/ROI focused custom report implemented right now.
Now, Over to You…
Custom reports are fantastic, as they allow you to clear out the rubbish and filter the wealth of data in GA to show just what you want to see. The six custom reports above are a great starting point to get you going on your PPC campaigns. However, the possibilities are endless – customise to your heart’s content until you have a solid set of reports to drive your campaigns forward.
Before making any changes to your paid accounts, ensure you are looking at the correct data: is it conversions or conversion rate you should be looking at? Are you looking at a specific goal completion or an overall summary? Has the campaign had enough traffic to start making decisions on bid adjustments? Double and triple check, as you wouldn’t want to starve or over-optimise your campaigns or you will end up in PPC hell!
For help with your PPC campaigns, get in touch with our experts today.