
If you’re not aware already – although, for your own sake, we hope you are – on 1st July, Universal Analytics will be sunsetted and you’ll need to learn how to use Google Analytics 4 going forward.
Not yet familiar with GA4 and looking for a place to start? This morning’s Breakfast Briefing, delivered by our analytical masterminds, Ben and Cat, provided many valuable insights – here’s our round-up of what you need to know.
Why is this happening?
There are a few key reasons why Google is forcing us to make the switch and it’s all in a bid to future-proof Google Analytics as we move into a privacy-centric digital world.
The current version of GA isn’t suited to address challenges that have come up in recent years such as the decline of cookies, the adoption of tracking blockers, and the increasing scrutiny on data privacy and GDPR regulations.
“The new Analytics is designed to adapt to a future with or without cookies or identifiers. It uses a flexible approach to measurement, and will include modeling to fill in the gaps where the data may be incomplete.”
Google Analytics 4 announcement, 2020
UA vs. GA4: the main differences
The main difference between the two is that GA4 is keeping up with the changing digital ecosystem while the current version of GA, Universal Analytics, is being left behind. 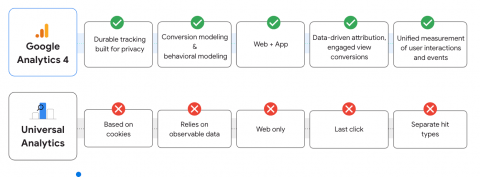 GA4 uses durable tracking that is built for privacy, conversion and behavioural modelling, data driven attribution and unified measurement of user interactions and events.
UA, however, is built on a cookie-based model of the web with fewer regulations on GDPR and privacy. This means UA relies on observable data and different clicks/hit types; the cookie-less future of advertising will soon render this type of data processing and measurement pretty much useless.
GA4 is an event-based model
What does this mean? Well, every bit of data in GA4 is submitted via an “Event” with optional parameters only.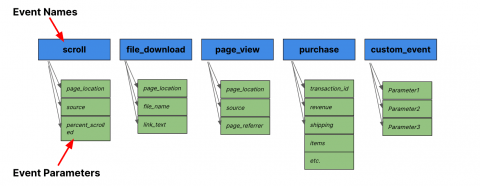 If your organisation runs both websites and mobile apps, you’ll now have a data model for analytics that intentionally makes data capture consistent across your ecosystem.
Even if you’re only using GA4 for a website or mobile app, you’ll have an event-based model which is vastly more flexible than the previous version. This means you can reimagine how your data capture works, the level of detail at which you want to track, and more.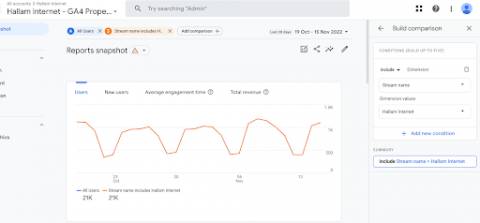 The issue with an event-based model is that it requires a lot of customisation to make it work for you. There are no more ‘multiple views’ within GA4 properties, but ‘Data Streams’ can act like UA’s ‘views’ property if you set them up in the right way. You can track apps and websites in a single report, or you can segment the reports.
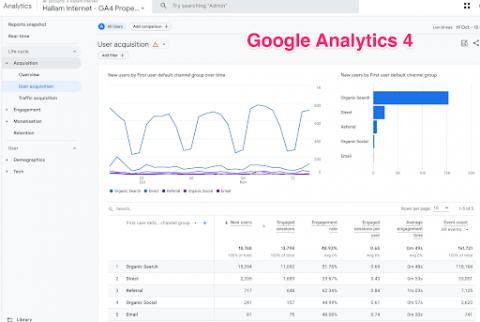 In GA4, you’ll see new metrics like ‘engagement rate’ and ‘engaged sessions’, tracking when a user visits your site for longer than 10 seconds, or when they view more than 2 pages.
These metrics are here to stay while the bounce rate metric has died – and we’re not mad about it. The new engagement metrics give a more insightful view into what users are doing on your site when viewing a page.
For example, a user may read a blog on your site that they found really useful, then leave the site; in UA, that would be classed as a bounce – a ‘bad’ metric.
However, GA4 recognises that bounce rate isn’t always a bad thing – replacing it with new engagement metrics allows a deeper view into whether your pages and their content are actually performing well by satisfying a user’s needs.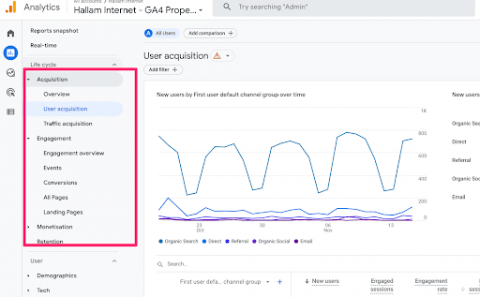 The number of standard reports in UA adds up to over 35 and many of these have been trimmed back in GA4 – a shock for many long-term UA users. GA4 is designed to efficiently collect data and customise as you need, rather than having reports readily available.
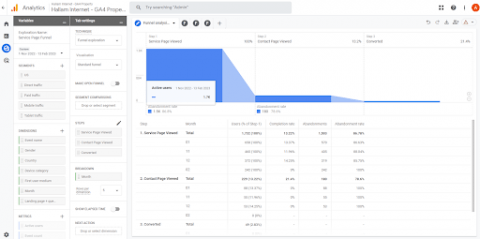 You’ll need to build your own reports in the Explore section. While the reporting process was much easier to follow on UA, GA4 gives a more efficient model of what is actually happening on your site, but only after you put the work in. It’s imperative to understand the platform and how you can customise it to your needs, so take time to play around with it and try things out between now and July.
If you want a more friendly looking, intuitive way to pull out the key stats, then Google Looker Studio is an excellent alternative.
The good
- The data model in GA4 is improved, based entirely on events and much more versatile.
- Bounce rate is dead at last, replaced with improved engagement metrics.
- The way events and conversions are set up is easier than in Universal Analytics, but it still takes some customisation.
- It handles a cookieless future in a sensible way.
- Improved visualisation options in the Explore section.
The overall direction of travel is toward ‘modelled’ data rather than absolute figures, providing a bigger picture of what’s actually happening on your website and helping to reduce the desire for absolute figures to see that something is worth investing in.
The bad
- Significant customisation work has to be put in to make effective use of GA4.
- Basic reports in the interface have less functionality.
- Loss of YoY data.
The overall direction of travel is toward ‘modelled’ data rather than absolute figures. While yes, we just said this was a good thing, it can also be seen as a bad thing to analysts who often want to get as much data as possible.
How can you fix the following issues in GA4…
1. Significant customisation work has to be put in to make effective use of GA
Learn the platform deeply, and build the reports your colleagues need. We offer GA4 training if you need close advice and one on one learning.
2. Basic reports in the interface have less functionality
Utilise Looker Studio to build more in-depth reports with better visuals.
3. Loss of YoY data
Export your data from UA & GA4 and start comparing the conversion rates over the course of the transition period.
Consider alternative platforms
There are plenty of other platforms offering similar features to GA4, such as Piwik Pro, Adobe Analytics, Matomo, mixpanel, Oribi and Leadoo.
Why use an alternative platform?
Pros:
1. You own your data
- Data is EU-based: there’s much less of a GDPR risk with PII in the EU as there is in the US (Google headquarters) as the EU has much more extensive data protection laws.
- Store your data on the cloud & with on-prem hosting.
- Control data retention.
2. You’re not obliged to Google services
- Different platform providers are incentivised by things other than ad revenue (unlike Google).
- Other platforms use less ad blocking than Google.
3. Improved Features
- Google can be very slow to roll out new features.
- Third parties want your business so innovate and provide new features far quicker.
Cons:
1. Limited integrations
- Other useful Google platforms like Tag Manager & Google Ads can’t easily be integrated with a third party platform.
- GA comes first – third parties will always build platforms to mimic Google.
2. Different definitions and metrics
- Communicating with stakeholders, whether client or agency side, can get complicated when you’re looking at things differently…
3. Complex setup
- It often requires IT involvement.
- Tends to be built for analysts more than marketers.
… and they’re also not free like Google is!
Although we would recommend sticking with GA, ultimately only you know which will be better suited to your business needs and the kind of data you want to get out of it.
Alternative metrics
Google’s switch to GA4 considers the fact that we’re going to have to start focusing on alternative metrics rather than just data attribution as a result of the increasingly privacy-friendly digital ecosystem – and in the long-run, alternative metrics should hopefully help us measure more meaningful data.
These are three tools that Google have suggested marketers start to use more commonly: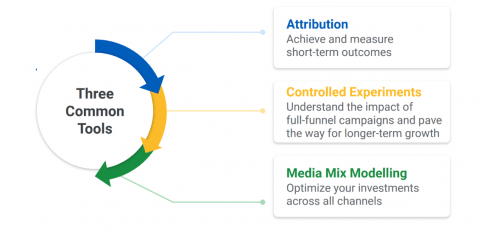 Attribution has always been the main tool used by marketers for measuring outcomes. But, as privacy makes it harder to attribute specific figures to metrics, GA4 caters towards a media mix modelling data approach.
Explained simply, imagine a scatter graph with revenue measured up the Y axis and a media type measured along the X axis, as you plot the graph, you can see how much was earned in revenue after each media output. Then, you add in a 3D element graph by adding another X axis with another media type along the bottom, drawing a 3D line of best fit through these scatter points. You keep adding more media types and dimensions to the graph (theoretically), until you can measure the revenue of 8 or 9 media types. Media mix modelling is measured like this, focusing on optimising budget allocation across different media channels, rather than following a small part of the customer journey, like attribution does.
Another proposed tool marketers should consider using for measuring metrics is controlled experiments. This could mean turning something on or turning something off for a period of time, and seeing how it affects your conversions. If you have the means to do this, then by all means go for it. We’d argue that however, not many businesses can afford this method of measurement, as it could lead to a drop in sales/conversions over lengthy periods.
Marketers are struggling with measurement tools
As we mentioned, the old school methods of data attribution just aren’t quite cutting it alone anymore. Many marketers are finding they aren’t seeing the outcomes they expect and are starting to invest in new tactics.
A recent survey by the Interactive Advertising Bureau on 2023 investment trends shows exactly this – the majority of marketers are investing in privacy friendly measurement tactics like marketing mix modelling and data clean rooms, and these tactics are expected to increase in importance even more over the year ahead.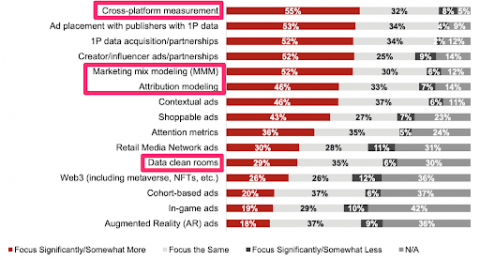
So, GA4 really is important?
There’s no two ways about it – yes, it’s really important.
And, if you’re running Google Ads, we also strongly recommend implementing Consent Mode and Enhanced Conversions: two advanced features that will help regain critical conversion data. If you haven’t enabled these two key features, you run the risk of making the wrong decisions, delivering sub-optimal results and impacting:
- Smart bidding – you’ll see significant drops in performance through bidding using incomplete data
- Audience targeting – malfunctioning due to data inaccuracies
- Performance reporting – artificially inflated CPA figures and a large portion of missing data
Takeaways
- The online tracking world has changed due to GDPR.
- The data model in GA4 is significantly different to Universal Analytics, based entirely on events.
- The reporting in GA4 is streamlined and has less functionality when it comes to page level reporting.
- When considering an alternative for UA, think about the larger picture – why do you need analytics?
Stuck and not sure what to do?
If you need help implementing GA4 or its new features, then we’re here to help.
Our team can implement and manage the set-up, and our turnaround times are usually 48 hours from the point of request/sale. Get in touch today.