

Read the recent changes here in our update, but feel free to read this blog too.
In May 2021, Google will introduce Core Web Vitals (CWV) metrics to form part of their search ranking algorithm. Here’s what you need to know, and do before then…
We all know fast sites are important. They create a better user experience, resulting in increased conversion rates and already factor in mobile search ranking in Google along with other page experience metrics like mobile-friendliness.
But Google is not stopping there. Back in May 2020, they told us about Core Web Vitals and on November 10 2020, they announced that in May 2021, Core Web Vitals will be incorporated as a search signal in the overall ranking algorithm.
In addition, they plan to “test a visual indicator that highlights pages in search results that have great page experience.” So not only do we have an increased chance of higher rankings through CWV optimisation, but we also have the prospect of increased click-through rates from search engine results pages.
Acting now to audit and fix any potential issues flagged with these new CWV metrics will give our sites a better chance of higher Google rankings when this change comes into effect in 2021.
But first, a recap…
Recap: what are Core Web Vitals?
Core Web Vitals are a set of 3 new page experience metrics that go into overall site speed scores. These metrics already take a prominent role in Google’s PageSpeed Insights tool PSI and Lighthouse Performance monitoring elsewhere.
The new CWV metrics comprise of the following: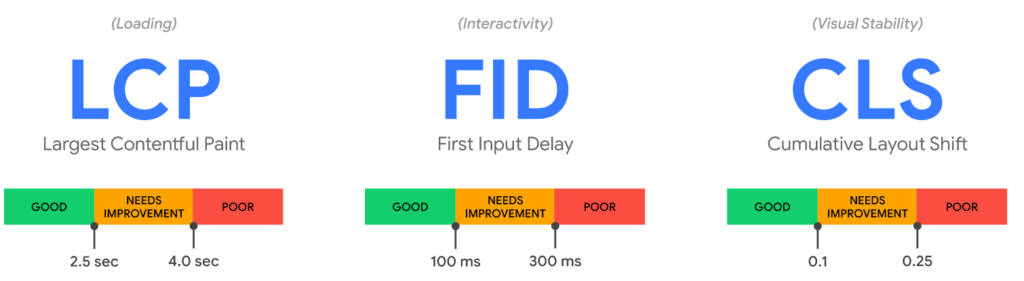
Largest Contentful Paint (LCP)
This is the time taken before the largest above the fold element is rendered to the user. It accounts for 25% of the overall speed score mechanism and therefore vitally important to streamline the delivery of the largest item to 2.5 seconds or lower on mobile.
Numerous factors contribute to a high LCP including server responsiveness, render blocking scripts and styles, complexity of CSS, fonts and images
First Input Delay (FID)
This measures interactivity; how responsive is the page to user input for example through taps or clicks. The target speed at which the browser responds to the first input should be 100ms or less.
If the browser is parsing or executing a lot of JavaScript during page load, this will tie up the CPU or block the ‘Main Thread’, causing devices to become less responsive to input. A high FID is usually an indicator of complex JavaScript. This could be a single script or function or numerous scripts.
Existing PSI metrics for Time to Interactivity and Total Blocking Time are related to FID, and collectively account for a whopping 35% of overall speed scores.
Cumulative Layout Shift (CLS)
This is a measure of visual stability of above the fold content. Whilst it only comprises 5% of overall speed scores, it is still worth considering in the overall picture. A high CLS can often indicate one or more changes in visual layout during page load, for example when banners are loaded shifting page content down.
Speed score breakdown
The diagram below shows a breakdown of the overall speed score and how big a role these new CWV metrics play in GPSI scores.
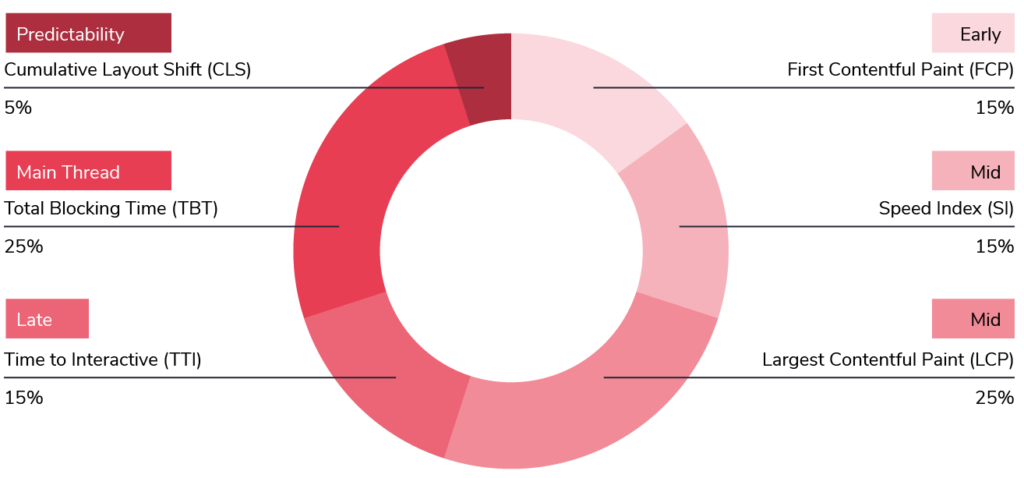
Source data from Lighthouse score update
Whilst non CWV metrics also form the overall score including First Content Paint (FCP), Time to Interactive (TTI) and Total Blocking Time (TBT), focussing on the three CWV metrics will have a direct impact on the others. A fast LCP is not possible for example without a fast FCP and high FID scores are directly impacted by TBT and TTI.
Tips for Largest Contentful Paint optimisation
The LCP metric is made up of numerous individual factors and directly impacted by a high FCP. If the FCP is being flagged as poor, you might want to start here. Anything from network connectivity, server responsiveness, Time To First Byte TTFB and render-blocking files will all affect the FCP value. For a deeper dive into some of these more generic page speed recommendations, check out our page speed eBook on the subject in addition to the LCP specific tips below.
If the LCP value is much higher than FCP, then we need to look at how we can better streamline the display of this largest element.
Determine the largest element
The first thing you’d probably want to do is determine what the largest element is. The largest element is based on pixel area which can change at different breakpoints, so a visual scan may not necessarily identify the right element.
In PSI, there should be a ‘Largest Contentful Paint element’ panel in the Diagnostic section. Alternatively, you can view the LCP by hovering over the indicator in Chrome’s Performance Monitoring tool as shown below.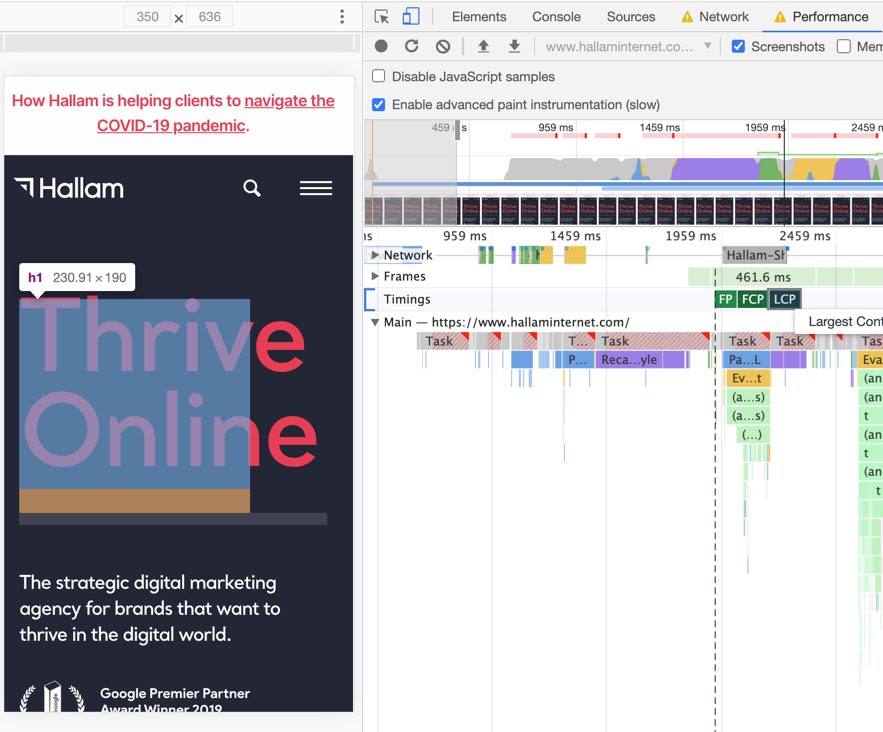
On the Hallam site in the example above, the Performance Monitor shows the LCP as the main ‘Thrive Online’ heading. Ideally, LCP should immediately follow FCP as in this example and if there is a gap between the two, we need to try and understand why.
Are fonts optimised?
If the largest above the fold element is typography, then we need to make sure font delivery is as streamlined as possible. This includes:
- Use the CSS font-display: swap; to ensure immediate font display while the font file is being loaded. Both Google Fonts and Adobe’s Typekit have the ability to set the font ‘display’ parameter.
- Try locally hosting .woff and .woff2 font files on the server instead of making cross-domain requests to third-party fonts. Google Fonts is pretty fast, Typekit fonts are slower and some third-party font foundries can be less reliable.
- Preloading font files can help. Locally hosted fonts will often be included in the websites main stylesheet, but this stylesheet has to be downloaded and parsed before an additional request is made to the font within. Preloading tells the browser to start downloading the font sooner, without waiting for the CSS to be parsed.
- Use preconnect and dns-prefetch for third party font foundries. These directives will help establish a DNS, TLS and TCP connections between third party domains prior to the request being made to the fonts.
- Only include font files for typography required for above the folding display. Font assets for icon libraries such as Font Awesome are notoriously heavy but requests to these (and the corresponding icon library CSS) can usually be deferred and loaded in after the <head> element.
- Do not make cross-domain requests to font files within the main site’s stylesheet as this relies on connectivity and additional lookup of a third party domain.
- Consider web-safe fonts. These don’t require any requests to font files, although can be very limited in terms of aesthetics.
Are images optimised?
Quite often, the largest above the fold element will be an image so important to ensure images are optimised. The following is good practice generally but especially important for the LCP element.
- Use the correct image file type. JPG images should be used for photographs, SVGs for vector graphics and icons or PNGs for more complex, non-photographic images and if transparency is required.
- Make sure JPG images are saved or output around 50-60% quality. At this level, there should be no discernible loss in quality. Also, make sure images have had metadata stripped from them.
- Compression plugins or services such as tinypng.com can automatically and bulk optimise images and strip out unnecessary meta data.
- Images should be appropriately sized for the area they are displaying in. Do not output the high-quality desktop image on mobile.
- Images should be output using the standard <img> tag with the ‘srcset’ attribute for responsive images.
- Below the fold or off-screen images should use the loading=”lazy” attribute.
- Use the next generation .web image file format for even better compression rates. This can easily save 30% and in many cases much higher.
- Consider preloading the largest above the fold image to initiate the download faster ahead of other, potentially less critical content.
Reduce render-blocking files
Any JavaScript or CSS file loaded in the <head></head> element is considered render-blocking as these files need to be downloaded before the page can start to render. This can have a huge impact on both the FCP and LCP metric. Render blocking files in the head should only be used if they are critical for the initial above the fold display on the page.
Removing any unused files in the <head>, loading non-critical files in the footer, or combining multiple files into fewer files will reduce the amount of render-blocking assets.
Do not use JavaScript to display the LCP
Prior to CWV, this was not a big deal. It’s common for JavaScript to be used to animate or display above the fold elements such as with fading text or hero carousels, often with little to no impact on speed scores.
If the display of the largest element relies on JavaScript, this can often cause a long delay as JavaScript has to be downloaded, parsed and executed before the element appears. JavaScript files are usually (and quite rightly) loaded after the <head> element so they are not ‘render-blocking’, but this means they can still effectively block the render of the LCP.
Take a look at the example below (logo blurred and heading changed) this is from an otherwise high scoring site in PSI. The LCP (the main heading text) is several seconds further away from the FCP which is caused by the requirement of JavaScript (represented by the yellow bands) to download, parse and execute before the text can fade in.
The text fading in itself can also be an issue, causing a delayed display of the largest element.
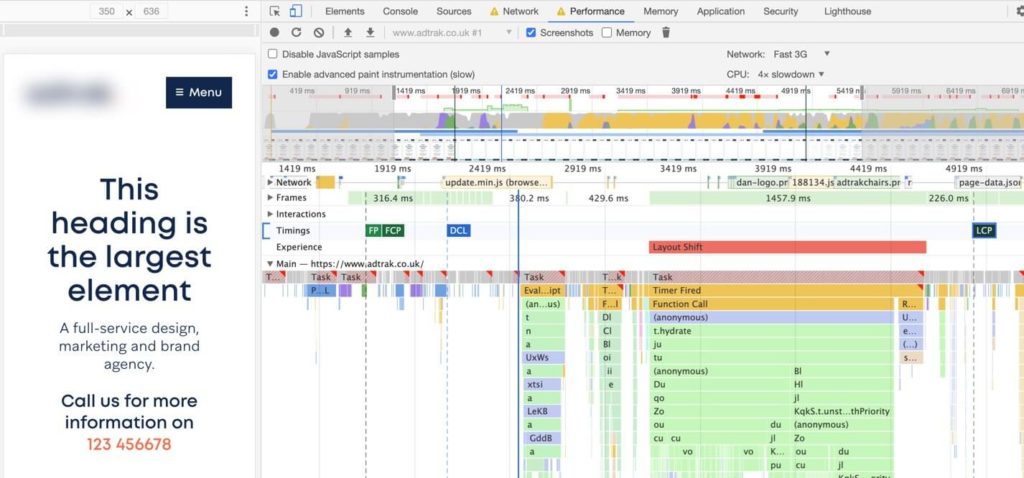
JavaScript techniques such as this can immediately reduce overall speed scores by 25% and should not be used to hinder or prevent the loading of the largest element in any way.
Execute Scripts on Window Load
JavaScript is rarely required (and shouldn’t be required) to display critical above the fold content, yet a common issue we see is that functions can be triggered as soon as the DOM is ready. In the popular jQuery framework, this is done through the ‘ready’ event. Google Tag Manager can also trigger functions or ‘tags’ on ready.
Consider triggering all JavaScript not required for critical display of content on the window load event, after the main page content is loaded to prevent any potential interference with the rendering of above the fold content and the LCP element.
Switch up the LCP
No matter how well optimised and streamlined an image is, it will almost always take longer to download and display vs a typographical element. Although it is entirely possible to achieve fast LCP scores for images, sometimes a tweak to reduce the largest image element so it is smaller than the largest text element will mean text can be used for the LCP instead.
This can make a big difference to scores, if the design allows, as shown in the example below where the LCP has been switched to a text element.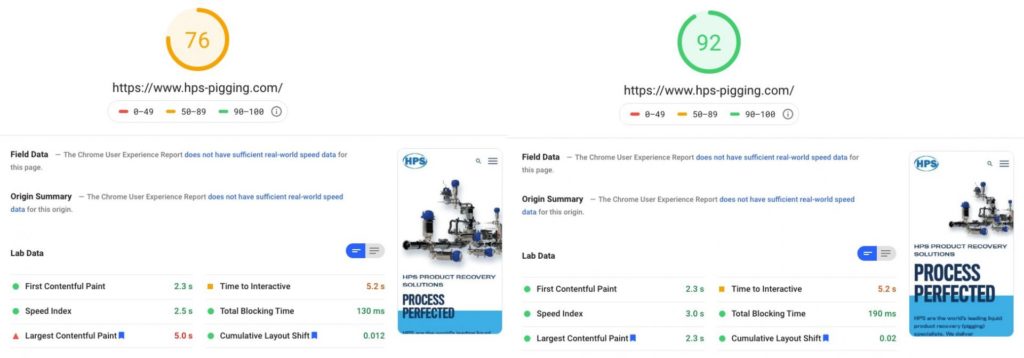
Tips for First Input Delay optimisation
As we’ve mentioned before, FID measures how responsive the page is to user input. It combines the Time To Interactive TTI and Total Blocking Time TBT which can account for up to 35% of overall speed scores.
These metrics are primarily affected by scripts parsing and executing as the page is being loaded; blocking the CPU’s main thread and potentially affecting device responsiveness, especially for lower-end smartphone devices.
It’s important to note that the ‘Lab Data’ shown in PSI does not measure FID directly. This is due to the interactive nature of the measurement from taps or clicks by the user which is hard to simulate. Instead, it is gathered by ‘Field Data’; measurements gathered from actual users over a 28 day period based on the Chrome User Experience Report CrUX.
As such, optimising for FID directly is a little harder, as we can’t change something and wait 28 days for more data to be gathered. We should therefore use the TTI and TBT metrics in the Lab Data for this instead as low times for these metrics will correlate to a low FID.
So how do we go about optimising for these metrics?
Audit your JavaScript
JavaScript can come in all shapes and sizes and it is not uncommon for a single video embed, chat widget, ReCaptcha script or HubSpot integration to be the sole cause behind the high FID, TTI and TBT metrics.
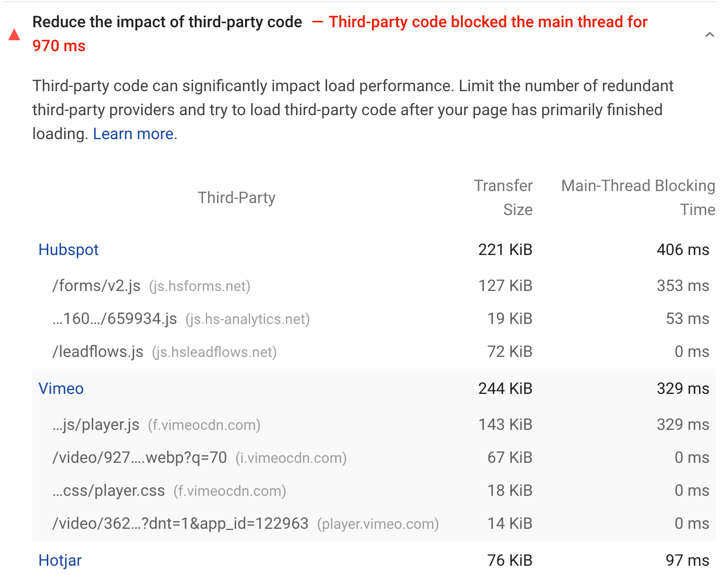
The diagnostic panels in Page Speed Insights are a good place to start. The section for ‘Minimize main-thread work’ will tell you how much execution time is taken up by JavaScript, the ‘Reduce JavaScript execution time’ section will indicate which files have high parsing and execution times and ‘Reduce the impact of third-party code’ will highlight and group high impact third party scripts.
The screenshot below shows a site that suffers from having several heavy scripts, with a Time to Interactive metric of 15 seconds. Many scripts are from third parties including HubSpot and Vimeo.
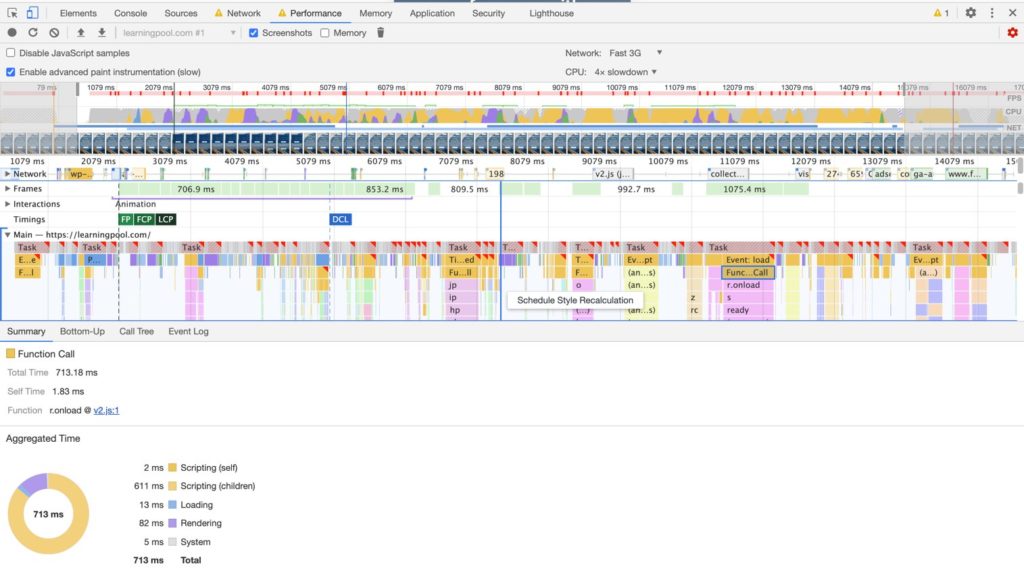
For a deeper analysis and visualisation into how these scripts impact the page load, Chrome’s Performance Monitor tool can be a great way to drill down into what scripts and functions are fired, the relative impact of these scripts, and at what point of page load these lengthy scripts are being executed.
The example below is from the same site and shows JavaScript represented by the yellow, pink and orange bars, with longer bars showing longer executing tasks. When we click on these longer tasks, we can see the highlighted scripts correlate to the large scripts highlighted by PSI above.
Once we have a better picture of what scripts are impacting performance, there are several techniques we can use to minimise their impact as outlined below.
Load Scripts asynchronously
JavaScript by default will execute in sequence. If there are any scripts that are not reliant on the loading of others, these scripts should be loaded with the ‘async’ attribute so they do not block the parsing and executing of other scripts.
Conditionally load JavaScript
A common problem we see on many sites is that heavy scripts are loaded globally or on pages when they are not needed. If you need to make use of ReCaptcha, for example, to help stop spam on form submissions, make sure to only load scripts on the pages that have forms.
Streamline JavaScript bundles
JavaScript libraries such as jQuery UI or Bootstrap are often used to provide additional JavaScript features and functions. If using a bundle, make sure to only include the relevant features within the bundle to save unnecessary JavaScript from being downloaded and parsed.
Lazy load scripts when needed
Even if JavaScript is only loaded on the pages it is needed on, the script itself does not necessarily need to parse and execute during page load or the window load event. Loading JavaScript only when it is actually needed can make a massive difference to TTI, TBT and FID metrics. Here are some examples:
- Video embeds such as YouTube and Vimeo are typically high impact. Consider only loading these scripts when clicking on a video thumbnail instead.
- Third-party form integrations such as HubSpot can be intensive. If the form appears in a modal, or at the bottom of a page, consider loading or injecting the required script on scroll or modal activation instead of page load.
- Live chat widgets can affect overall speed scores by up to 35%. Consider moving the live chat widget to a dedicated contact page with supporting global ‘live chat’ CTA, or injecting the live chat script only when a ‘chat with us’ button is clicked.
- Adding the ‘loading=”lazy” attribute on embedded iFrame based content can help, but it is a new browser feature and will need testing depending on the iFrame embed used.
Assess business intelligence tools
Analysing user behaviour with tools such as Hotjar or A/B Testing software such as VWO is really important to business intelligence and in many cases, their benefits will outweigh the impact on site speed.
Having said that, it is still worth evaluating the importance of running these tools 24/7 depending on how frequently data is being analysed. A/B testing should be turned off if no active tests are running for example and behaviour analysis tools such as Hotjar may be deactivated after enough data has been gathered and processed.
Tips for Cumulative Layout Shift optimisation
Cumulative Layout Shift (CLS) may only account for 5% of overall speed scores, but still, an important part of the overall picture especially as high amount of shifting elements on page load can be a jarring experience for the user.
Determine CLS element
Sometimes it may appear obvious what element or elements cause a shift in the content, but it’s always worth verifying this through the Layout Shift panel in PSI as shown below.
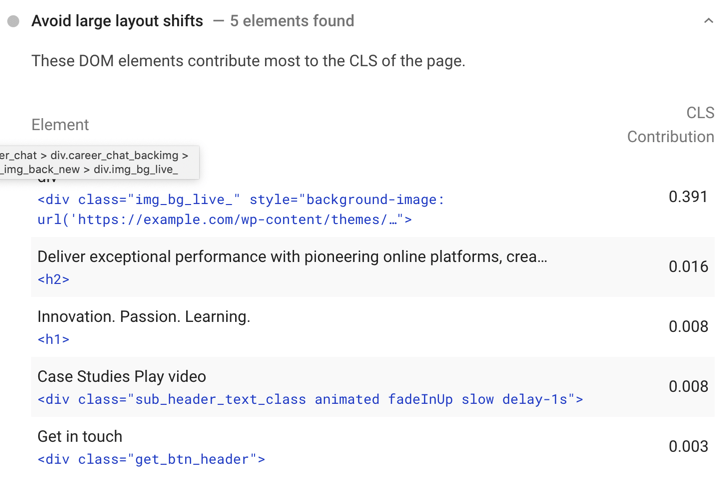
The CLS metric should be below 0.1, but in the example above, this is exceeded by over 400% and will cost a 5% drop in scores. If this is a global issue, that’s 5% on every page.
Shifting elements should be identified and addressed in order of impact and may include elements above and below the fold. We’ve highlighted some of the most common causes and resolutions of layout shifting below.
Watch out for animation
It’s quite common for certain animation techniques to be used to change the way content is presented to the user for example by fading or sliding in images, text or panels of content as the user scrolls down a page. While these might be aesthetically pleasing (depending on who you ask) it is important that these techniques do not shift any content around during page load.
If you have to hide and then fade content to the user, make sure the container size or total page height does not change as content as being loaded in. Content can be hidden (if necessary) using CSS visibility rules rather than display: none; which will preserve the underlying amount of space it needs.
Specify image dimensions
If the <img> tag does not have width and height attribute set, or CSS is not being used to set the dimensions or ratio of the image, browsers will need to download the image first before being able to determine the pixel area it needs to display in. This can cause a shift of any content rendered below the image, as the image is loaded.
Specifying the width and height of the image, or setting the dimensions or ratio of the image (or the parent container) within CSS prior to the image being download will ensure browsers will know the area in which the image needs to display and avoid potential layout shift.
Banners
Advertisements, cookie law bars or any other information used to display important information in a banner are probably one of the most common causes of a high CLS.
It is common for banner content to be loaded from an external data source, or via JavaScript from the same site which means the size of the banner container may not be possible to calculate until the content has been loaded. When this happens, the content below the banner will shift down once the banner content is loaded and displayed to the user.
There are a number of resolutions to this:
- Set a minimum height for the banner or banner container in CSS so the browser can effectively render a placeholder. Though this can be problematic if the amount of content is dynamic and unknown.
- Absolutely or fix the position the banner at the top or bottom of the screen. For banners that can be closed or dismissed, this is a good consideration as fixed elements will not affect the positioning of any other elements.
- Look at server side rendering of banner content if possible which means content and banner dimensions can be loaded upfront before it reaches the user.
Summary
Hopefully, you’ll find some of the techniques highlighted above useful in diagnosing and troubleshooting performance issues around Google’s new Core Web Vitals. Over the past few months at Hallam, we have helped a number of clients improve their website’s performance both in terms of our speed audits and direct improvements made by our development team.
If you found this article helpful, you may also want to check out our website performance eBook which takes a deeper dive into some of the more generic recommendations around page speed that anyone building or managing a website can benefit from.