
Last week, Google announced that AdWords users will now be able to add more personalisation to their reporting, by creating formulas in custom columns tool.
In light of this latest addition, I will show you how to create custom columns using the new formulas feature to further refine your AdWords reporting.
What are Custom Columns?
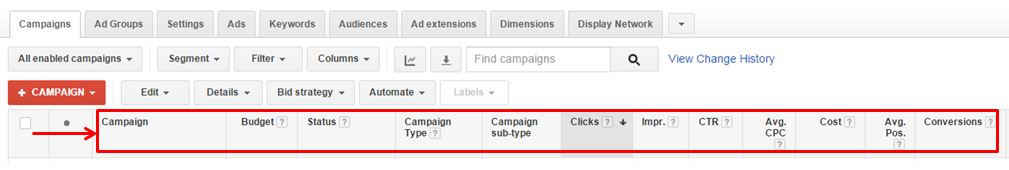
Available for over a year now, AdWords custom columns allow you to manipulate and further segment reporting metrics. As a result, you can fully tailor the reporting interface to suit your goals and objectives:
So why are custom columns important, and why should you be using them?
AdWords already has a wide range of useful reporting columns as standard that you can add, reorder, and remove at your convenience. Yet custom columns is a great tool that can help open up new advertising opportunities, enabling you to identify any potential savings on your spend.
How to Create Custom Columns with Custom Formulas
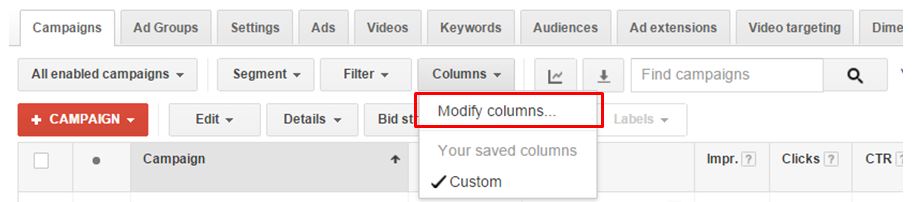
In case you’re not already aware, the reporting columns that are in place can be modified to suit your requirements. For example, if you wanted to identify the cost per converted click of your campaign, a column for this metric can be easily added by clicking Modify Columns at either Campaign or Ad Group level:
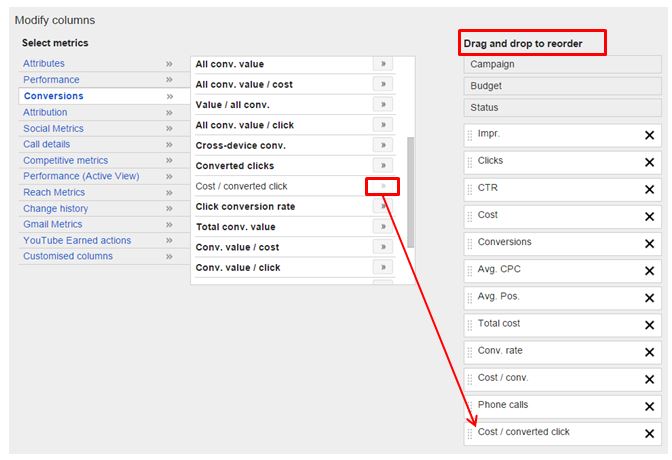
From here you can cycle through a wide range of metrics. You can remove or reorder as columns within the Drag and drop to reorder section:
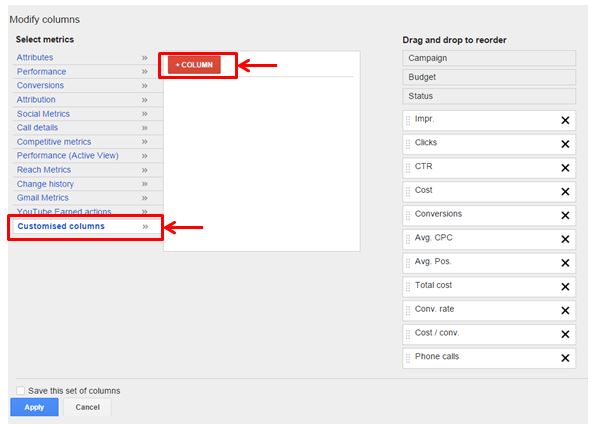
Setting up custom columns with the new formulas feature is a relatively straightforward process. To create a custom column, click Custom Columns at the bottom of the options on the left side of the screen. All your previously created custom columns can be found here. To add a new one, click +Column:
Give your new custom column a name and add a description. Descriptions aren’t mandatory, but they’ll be helpful for any other users managing your account.
As a basic example, if you wanted a column to show the percentage of clicks within a campaign or ad group that came from mobile devices, this is where a custom column would come in handy.
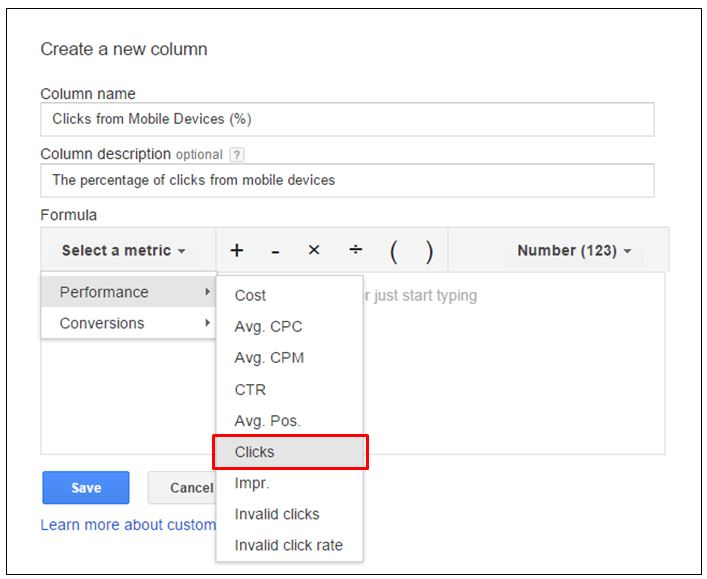
First, you would Select a metric, and the range of metrics are categorised by Performance and Conversion. Performance metrics include total clicks and impressions, while Conversion metrics include total recorded conversions, converted clicks, cost per conversion, and much more. There’s a lot to choose from, but for this example we will choose clicks from the Performance category:
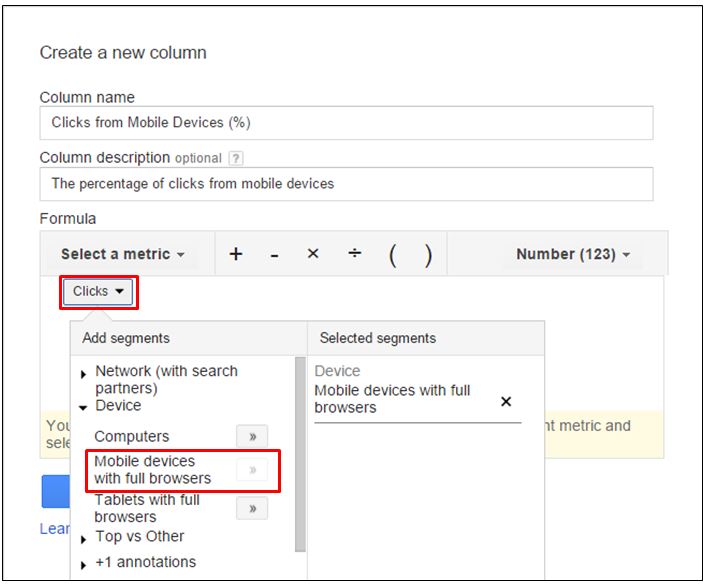
Once you have selected clicks, you will be presented with more options to add more focus to the metric. In this case, we will choose Device and then add Mobile devices with full browsers:
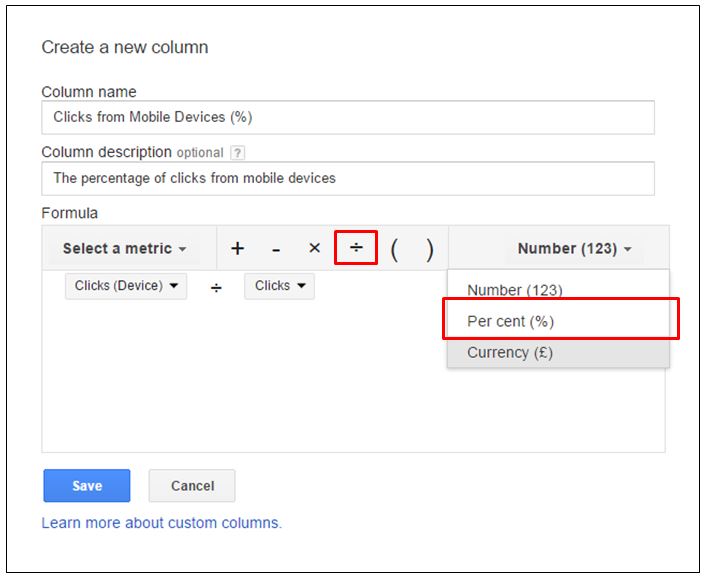
For percentage metric, you need to click ÷ and then select Clicks, again from Select a metric. To complete your formula, just select per cent (%) from the drop down. You can also choose number and currency depending on the calculation that you want AdWords to complete:
Click Save and then Apply on the Modify Columns window.
And there you have it! Your new custom column to report a percentage of mobile device clicks will now be visible within the AdWords reporting interface. As mentioned earlier, you can fully manage your reporting columns by reordering or removing any that become redundant.
It’s great to see that Google is still committed to refining the AdWords interface, and the new formulas feature for custom columns will further encourage paid search marketers to become even more creative with their reporting.
Going back to their announcement, Google used an example to calculate your profit margin per sale through AdWords using custom formulas. So it will be interesting to see what AdWords users come up with and share over the coming weeks.
Have you put together any awesome formulas already? We’d love to hear from you!