What is a server log file?
A server log is a log file (or several files) automatically created and maintained by a server consisting of a list of activities it performed.
For SEO purposes, we are concerned with a web server log which contains a history of page requests for a website, from both humans and robots. This is also sometimes referred to as an access log, and the raw data looks something like this:
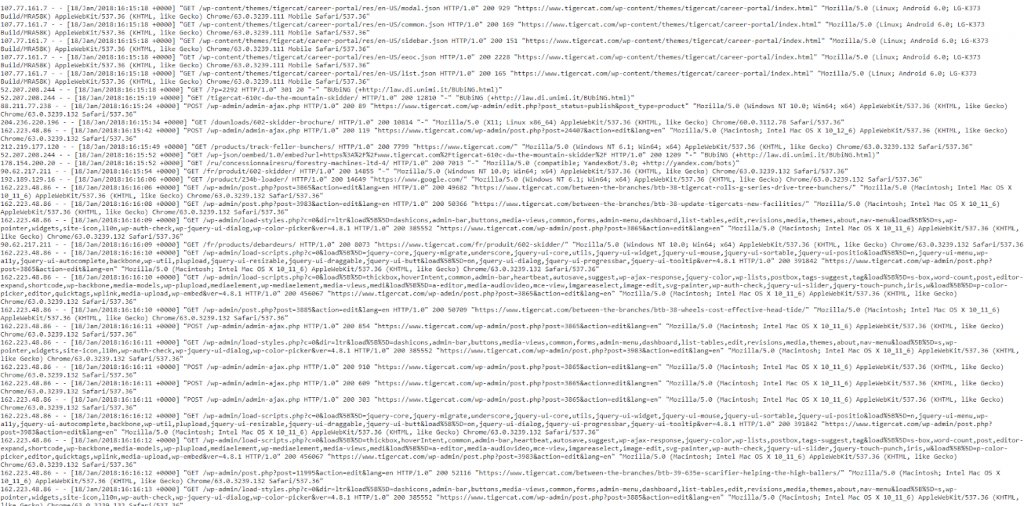
Yes, the data looks a bit overwhelming and confusing at first, so let’s break it down and look at a “hit” more closely.
An Example Hit
Every server is inherently different in logging hits, but they typically give similar information that is organised into fields.
Below is a sample hit to an Apache web server (this is simplified – some of the fields have been taken out):
50.56.92.47 – – [01/March/2018:12:21:17 +0100] “GET” – “/wp-content/themes/esp/help.php” – “404” “-” “Mozilla/5.0 (compatible; Googlebot/2.1; +http://www.google.com/bot.html)” – www.example.com –
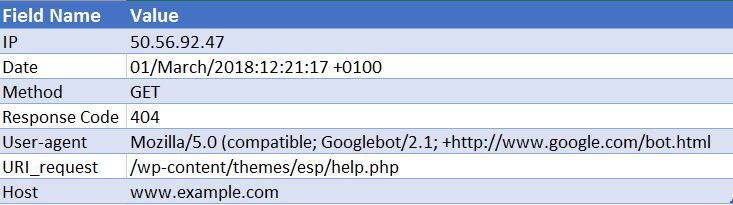
As you can see, for each hit we are given key information such as the date and time, the response code of the requested URI (in this case, a 404) and the user-agent that the request came from (in this case Googlebot). As you can imagine, log files are made up of thousands of hits each day, as every time a user or bot arrives at your site, many hits are recorded for each page requested – including images, CSS and any other files required to render the page.
Why Are They Significant?
So you know what a log file is, but why is it worth your time to analyse them?
Well, the fact is that there is only one true record of how search engines, such as Googlebot, process your website. And that is by looking at your server log files for your website.
Search Console, 3rd party crawlers and search operators won’t give us the whole picture on how Googlebot and other search engines interact with a website. ONLY the access log files can give us this information.
How Can We Use Log File Analysis for SEO?
Log file analysis gives us a huge amount of useful insight, including enabling us to:
- Validate exactly what can, or can’t be crawled.
- View responses encountered by the search engines during their crawl e.g. 302s, 404s, soft 404s.
- Identify crawl shortcomings, that might have wider site-based implications (such as hierarchy, or internal link structure).
- See which pages the search engines prioritise, and might consider the most important.
- Discover areas of crawl budget waste.
I will take you through some of the tasks you can carry out during your log file analysis and show you how they can provide you with actionable insights for your website.
How Do I Get Hold Of Log Files?
For this type of analysis, you require the raw access logs from all the web servers for your domain, with no filtering or modifications applied. Ideally, you’ll need a large amount of data to make the analysis worthwhile. How many days/weeks worth this is, depends on the size and authority of your site and the amount of traffic it generates. For some sites a week might be enough, for some sites you might need a month or more of data.
Your web developer should be able to send you these files for you. It’s worth asking them before they send over to you whether the logs contain requests from more than a single domain and protocol and if they are included in this logs. Because if not, this will prevent you from correctly identify the requests. You won’t be able to tell the difference between a request for http://www.example.com/ and https://example.com/. In these cases, you should ask your developer to update the log configuration to include this information for the future.
What Tools Do I Need to Use?
If you’re an Excel whizz, then this guide is really useful at helping you to format and analyse your log files using Excel. Personally, I use the Screaming Frog Log File Analyser (cost $99 per year). Its user-friendly interface makes it quick and easy to spot any issues (although arguably you won’t quite get the same level of depth or freedom as you would gain by using Excel). The examples I’ll be taking you through are all done using the Screaming Frog Log File Analyser.
Some other tools are Splunk and GamutLogViewer.
9 Ways To Analyse Log Files for SEO
1. Find Where Crawl Budget is Being Wasted
Firstly, what is crawl budget? Google defines it as:
“Taking crawl rate and crawl demand together we define crawl budget as the number of URLs Googlebot can and wants to crawl.”
Essentially – it’s the number of pages a search engine will crawl each time it visits your site and is linked to the authority of a domain and proportional to the flow of link equity through a website.
Crucially in relation to log file analysis, crawl budget can sometimes be wasted on irrelevant pages. If you have fresh content you want to be indexed but no budget left, then Google won’t index this new content. That’s why you want to monitor where you spend your crawl budget with log file analysis.
Factors Affecting Crawl Budget
Having many low-value-add URLs can negatively affect a site’s crawling and indexing. Low-value-add URLs can fall into these categories:
- Faceted navigation, dynamic URL generation and session identifiers (Common for e-commerce websites)
- On-site duplicate content
- Hacked pages
- Soft error pages
- Low quality and spam content
Wasting server resources on pages like these will drain crawl activity from pages that do actually have value, which may cause a significant delay in discovering good content on a site.
For example, looking at these log files, we discovered that an incorrect WordPress theme was being visited very frequently, this one is an obvious fix!

When looking at the number of events each page is getting, ask yourself whether Google should be bothering crawling these URLs – You’ll often find the answer to be no. Therefore, optimising your crawl budget will help search engines crawl and index the most important pages on your website. You can do this in a number of ways, such as excluding URLs from being crawled by blocking URLs containing certain patterns with the robots.txt file. Check out our useful post on the subject.
2. Are Your Important Pages Being Crawled at All?
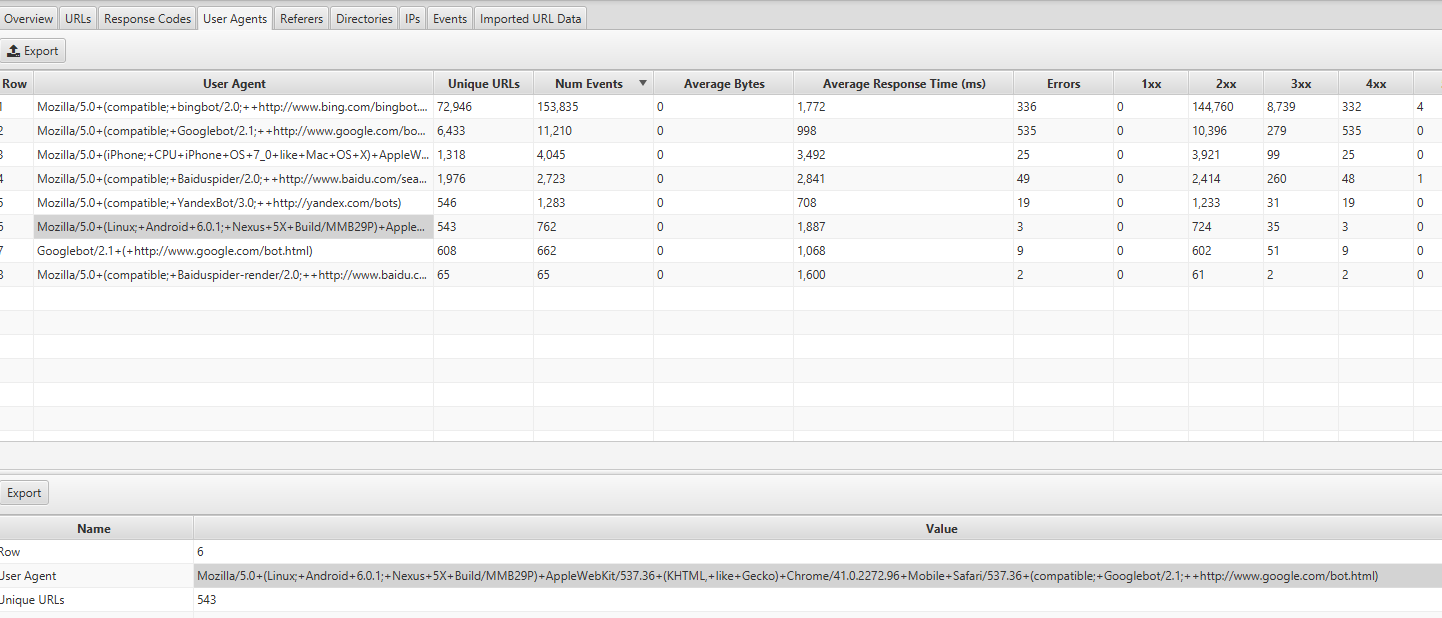
We’ve covered why it’s important for Google not to waste crawl budget on your low-value pages. The other side of the coin is to check that your high-value pages are being visited with the importance that you place on them. If you order your log files by Number of Events and filter by HTML you can see what your most visited pages are.
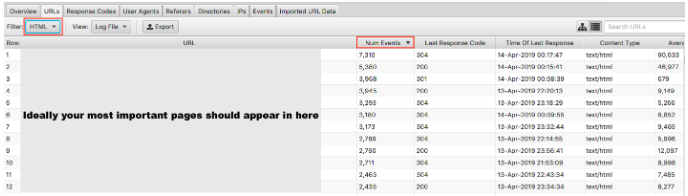
It would be somewhat oversimplified to say your most important URLs should be crawled the most – however, if you’re a lead gen site, you want your homepage, key service pages and blog content to appear in there.
As an e-commerce site, you would want your homepage, category pages and key product pages to appear in there. If you’re seeing an old product page that you no longer sell and zero of your most important category pages in these results, you have an issue.
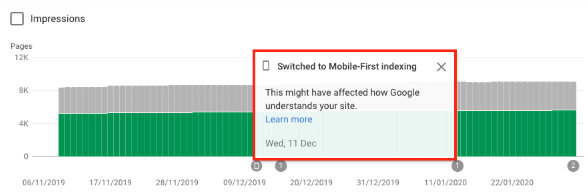
3. Find Out If Your Site Has Switched To Google’s Mobile-First Index
You can log file analysis to know if your website is getting the increased crawling by Googlebot Smartphone, indicating it’s been switched to the mobile-first index. As of July 1, 2019, mobile-first indexing is enabled by default for all new websites (new to the web or previously unknown to Google Search). Google themselves have stated:
“For older or existing websites, we continue to monitor and evaluate pages based on the best practices detailed in this guide. We inform site owners in Search Console of the date when their site was switched to mobile-first indexing.” Google Mobile-first indexing best practice
Typically a site still on the regular index will have about 80% of Google’s crawling done by the desktop crawler and 20% by the mobile one. It’s most likely you have been switched to mobile-first, and if you have, those 80/20 numbers will reverse.
You can find this info by looking at the User Agents tab in Screaming Frog Log Analyser – you should see most of the events coming from Mozilla/5.0 (Linux; Android 6.0.1; Nexus 5X Build/MMB29P) AppleWebKit/537.36 (KHTML, like Gecko) Chrome/41.0.2272.96 Mobile Safari/537.36 (compatible; Googlebot/2.1; +http://www.google.com/bot.html:
If you have been switched, you should also have received a notification in Google Search Console that your website has had mobile-first indexing enabled. Alternatively, you can see this in the coverage report too.
4. Are All of Your Targeted Search Engine Bots Accessing Your Pages?
Sticking with bots, this is an easy check to carry out. We know that Google is the dominant search engine and therefore ensuring Googlebot Smartphone and Googlebot are regularly visiting your website should be your priority.
We can filter the log file data by search engine bot.
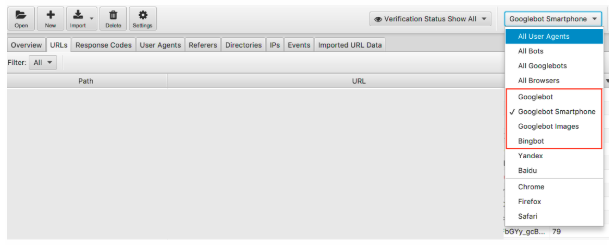
Once filtered, you can look to see the number of events each of your desired search engine bots are recording. Hopefully, you’ll see the Googlebot Smartphone or Googlebot visiting your site the most.
I’d also recommend checking how much each undesired bot is visiting your website. For example, if you are a British business with no desire to sell goods or services to Russia or China, you can see how much the Yandex and Baidu bots are visiting your site. If they are visiting an unusual amount (I have seen in some instances they visit more than Googlebot Smartphone) you can go ahead and block the crawlers in your robots.txt.
5. Spotting Incorrect Status Codes
Whilst we get a tonne of data in Google Search console coverage report about 404s, valid 200s, log files give us an actual overview of the status codes of each page. Only log files or manually submitting Google Search Console’s fetch and render can allow you to analyse the last response code the search engine will have experienced.
With your Screaming Frog Log File Analyser, you can do this quickly and, because they are ordered by crawl frequency, you can also see which are potentially the most important URLs to fix.
To see this data, you can filter this information under the response codes tab
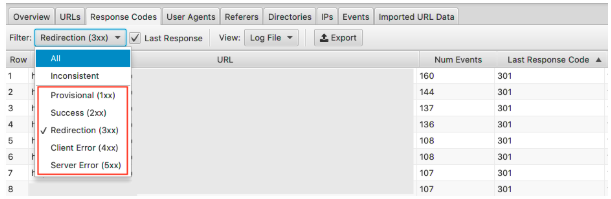
Look for pages with 3xx, 4xx & 5xx HTTP statuses
- Are they being visited frequently?
- Are pages with 3xx, 4xx & 5xx being visited more than your important pages?
- Are there any patterns to the response codes?
With one project, in their top 15 pages with the most hits, there were redirects, incorrect 302 (temporary) redirect, pages with no content on them and some which were 404s and soft 404s.
With your log file analysis, once you have identified the issue you can start fixing it by updating incorrect redirects and soft 404s.
6. Highlight Inconsistent Response Codes
Whilst it is important to analyse the last response code the search engine will have experienced, highlighting inconsistent response codes can give you great insight too.
If you looked purely at the last response codes and saw no unusual errors or any spikes in 4xxs & 5xxs you might conclude your technical checks there. However, you can use a filter in the log file analyser to only view ‘inconsistent’ responses in detail.
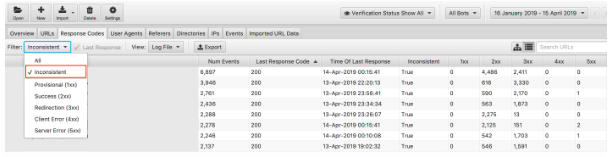
There are many reasons why your URLs might experience inconsistent response codes. For example:
- 5xx mixed with 2xx – this can point to a server issue when they are under a severe load.
- 4xx mixed with 2xx – this can point to broken links that have appeared or been fixed
Once you have this information from your log file analysis to hand, you can create your plan of action to fix these errors.
7. Audit Large or Slow Pages
We know time to first byte (TTFB), time to last byte (TTLB), and time to full page load influence how your site is crawled. TTFB, in particular, is key to getting your site crawled fast and effectively. With page speed also being a ranking factor we can see how crucial a fast website is to your performance.
Using log files we can quickly see the largest pages on your website and the slowest ones.
To view your largest pages, sort the ‘Average Bytes’ column.
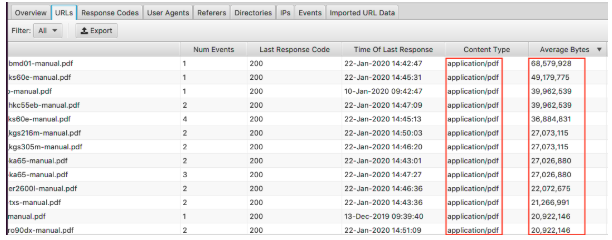
Here we can see PDFs make up the largest pages on the website. Optimising these and reducing their size is a great place to start. If you’re seeing particular pages appear on here you might want to look at them individually.
- Are they covered with high-res images?
- Do they have videos auto-playing?
- Do they have unnecessary custom fonts?
- Has text compression been enabled?
Whilst the size of the page is a good indicator of a slow page, it isn’t everything. You can have a large page but it can still load fast. Sort the ‘Average Response Time’ column and you can see the URLs with the slowest response time.
As with all the data you see here, you can filter by HTML, JavaScript, Image, CSS & more, which is really useful for your audit.
Perhaps your aim is to reduce your website’s reliance on JavaScript and want to spot the biggest culprits. Or you know the CSS can be streamlined and need the data to back it up. Your site might load at a snail’s pace and filtering by images demonstrates to you that serving next-gen formats should be a priority.
8. Check Internal Links & Crawl Depth Importance
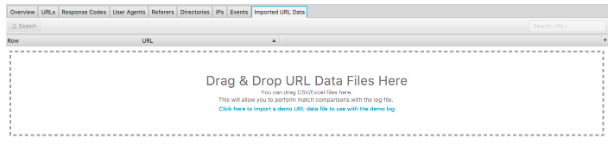
Another great feature of this log file analyser is the ability to import a crawl of the website. It’s really easy to do and gives you much more flexibility in what you can analyse from your log files. Simply drag and drop the crawl into the ‘Imported URL Data’ seen below.
Once you’ve done that you can do further analysis.
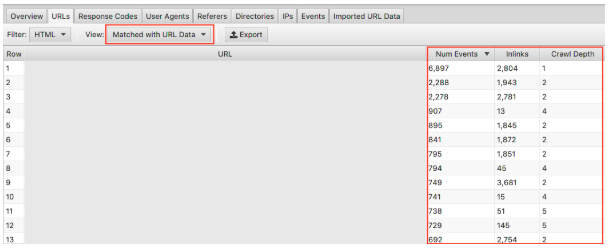
Make sure you select in the drop-down ‘Matched with URL Data’ and drag the relevant columns into view. Here we can do bulk analysis on the impact that the crawl depth and inlinks has on the crawl frequency of your website.
For example, if you have ‘important’ pages that are not getting crawled frequently and you spot they have very few inlinks and the crawl depth is above 3, this is most likely why your page isn’t being crawled much. Conversely, if you have a page that is being crawled lots and you’re not sure why, look at where it sits in your site. Where it is linked? How far away from the root is it? Analysing this can indicate to you what Google likes about your site structure. Ultimately, this technique can help you identify any issues with hierarchy and site structure.
9. Discover Orphaned Pages
Finally, with the crawl data imported, spotting orphaned pages is easy. Orphan pages can be defined as pages that search engines know about, and are crawling but are not linked to internally on your website.
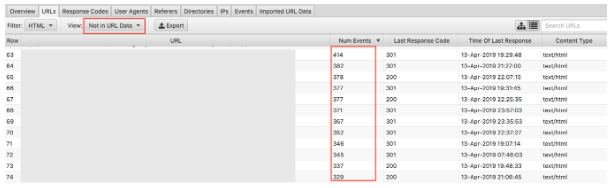
Selecting the drop-down ‘Not in URL data’ will bring up URLs that are present in the logs but not in your crawl data. Therefore, URLs that appear here will be pages that search engine bots still think hold value, but no longer appear so on the website. Orphaned URLs can appear for many reasons including:
- Site structure changes
- Content updates
- Old redirected URLs
- Incorrect internal linking
- Incorrect external linking
Ultimately, you need to review the orphans URLs that you find and make a judgement call of what to do with them.
Final thoughts
So that’s my brief introduction to log file analysis and 9 actionable tasks you can start right away with the Screaming Frog Log File Analyser. There’s a huge amount more you can do, both in Excel and with the other tools mentioned above (plus others). More than I can possibly cover here! Below are some resources I’ve found useful:
7 Fundamental Technical SEO Questions to Answer With A Log File Analysis
The Ultimate Guide to Log File Analysis
The Value of Log File Analysis
And there are loads more out there to read which should satisfy the most curious of technical SEO enthusiasts!
How do you carry out log file analysis? What tools do you find work best? Our SEO team would love to know. Comment below.
Have you just learned something new?
Then join the 80,000 people who read our expert articles every month.