A content marketing dashboard helps you to evaluate and measures how well the content on your website is performing. It will help you to answer the following questions:
- How well your content is helping you to reach new audiences
- How engaging is your content
- How much your content contributes to your goals and conversions
- What sources are driving traffic to your content
- How well your content is doing in social media.
We have created a free Google Analytics Dashboard for you that will help you measure your content effectiveness:
In order to use this Dashboard, you will need to first login to your Google Analytics account.
Then click on this link to access the dashboard template. You will be prompted to select the view and profile of your Analytics account, and then the report template will be added to the Customisation |Dashboard section of your Analytics.
This Dashboard will appear with the name Content Analysis | © HALLAM Dashboards
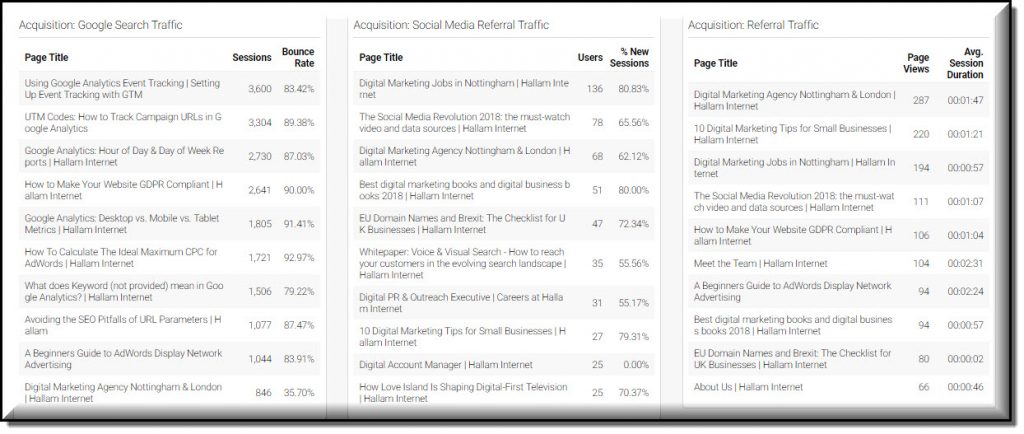
What you are seeing here is a screen grab using the Dashboard with my data. The dashboard comprises 10 “widgets” which are quick and simple data breakdowns of your most important content marketing metrics.
Don’t worry. When you import the Dashboard into your account, you will immediately see it full of your own data!
This report is broken down into 4 main sections:
Acquisition: how well your content is helping you to reach new prospective clients and helping them to discover your business
Engagement: how satisified and engaged are your visitors with your content
Conversion: does your content spur your visitors into taking action
Social Media Impact: how effective is your content on the social networks
Understanding Your Audience:
1. Content effectiveness: acquisition
The first section of the dashboard identifies your top performing pages in terms of the Acquisition process. Acquisition means reaching new prospective customers, getting discovered by new people.
If you are using content marketing as part of a lead generation strategy, then this is about filling the top of the funnel by reaching new users.
This section of the dashboard measures how effective your content is in terms of reaching visitors via
- Google Search Traffic
- Social Media Traffic
- Web Referral Traffic
- New Users by Landing Page
Taking one of the widgets as an example:
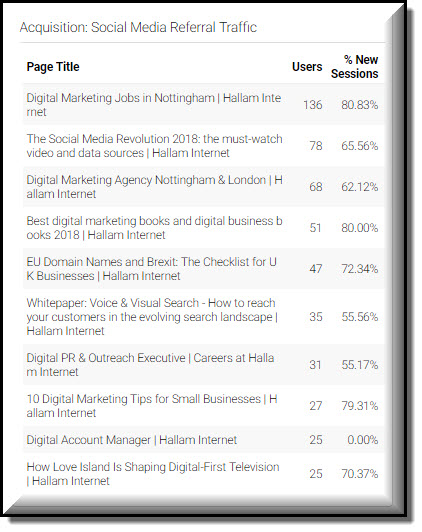
Acquisition: Social Media Referral Traffic: How does sharing your on social media like LinkedIn or Twitter drive clicks to specific content on your website.
Your Action: what kinds of social messaging drives clicks thru to your content. What works well and gets the click enagement… and what doesn’t?
In this report, we can see that our social media is most effective at driving visitors interested in our Careers and Employment content, as well as to our thought leadership content like our blog posts and white papers.
Acquisition: Google Search Traffic. Identify which content on your website is getting clicks from the Google search results. This table includes the number of sessions, and Bounce Rate, meaning they viewed this one page from the search results and then left the site.
Acquisition: Referral Traffic: when your content is referenced on other sites, what clicks are generated through from this referring sites?
Acquisition: New Users by Landing Page: New Users is a prime measure of reaching fresh audiences. This table gives the number of New Users, and the percentage of total sessions that are indeed new.
For each of these acquisition channels, you need to be developing an action plan to assess:
- is the content you are generating well enough optimised so that users are discovering it in sufficient numbers via organic search?
- if you are getting lots of visitors from organic search, are they sticking around to consume other content on your site?
- is your content getting discovered by NEW users
- and are you keeping an eye on your content metrics to see it is also of sufficient interest to your RETURNING visitors
- if you are using outreach to place your content on other sites or social channels, is it delivering good results by driving traffic to your site?
Look good? Get your own copy of our free Google Analytics Dashboard for you that will help you measure your content effectiveness
2. Content effectiveness: engagement
Engagement is the second of our content marketing objectives.
If acquisition tells us how effective we are helping prospective customers discover our content, then engagement metrics tell us how satisfied visitors are with the content and experience.
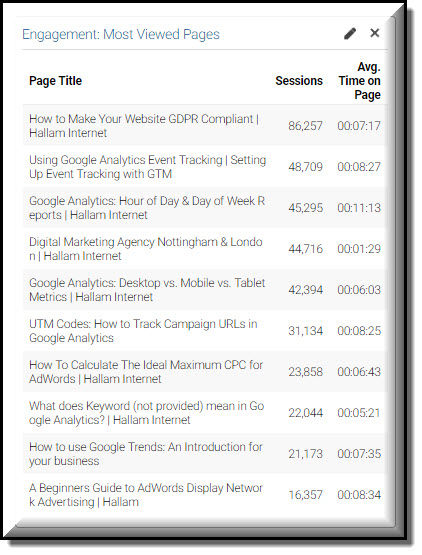
The first widget in this section of the report measures popularity in terms of how many page views a page receives. On its own, though, this metric doesn’t say much about engagement. Lots of pageviews might show you how well your page ranks for a high volume keyword, or how good the title is, but not how well it performs past the entrance stage.
This widget also includes the Average Time on Page metric. We are reporting quite high times on pages.
What are we learning in terms of our content strategy? Our most popular content because these tend to be “how to guides” with detailed instructions.
And what else are we learning? We are getting the most visits to pages that users also seem to be most engaged with.
3. Content effectiveness: conversion
The penultimate section of this Dashboard is about Goals and Conversion.
You are measuring how your content contributes to your business goals, which might typically include
- Contact form completions
- Telephone calls
- Newsletter sign-ups
- Account creation
- White paper or e-book downloads
Using this Dashboard for our site, we are able to see the specific types of content driving our conversions, and we are also able to see how many pages of content are viewed, the Page Depth, before the goal completion happens:
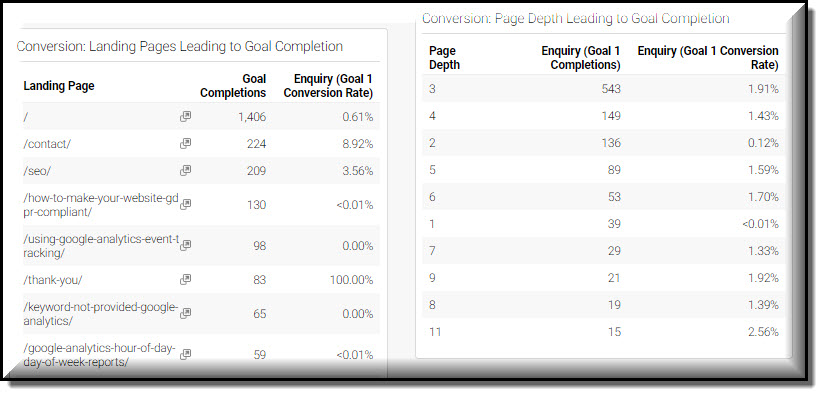
Before you can use the first content marketing widget, “best converters”, you’ll need to have a goal, which lets you measure how often visitors complete actions that meet your objectives. If you don’t have goals already, take a look at this post about how to set up a goal in Analytics.
You won’t be able to use the widget, however, if your goal is the completion page for an ecommerce transaction, as this is not measured from your content pages.
4. Content effectiveness: social media channels
Social sharing means success in a world what other people say about you is more important than what you say about yourself.
The “social sources” widget shows you where your social traffic is coming from by measuring sessions.
It combines the metric Pages/Session
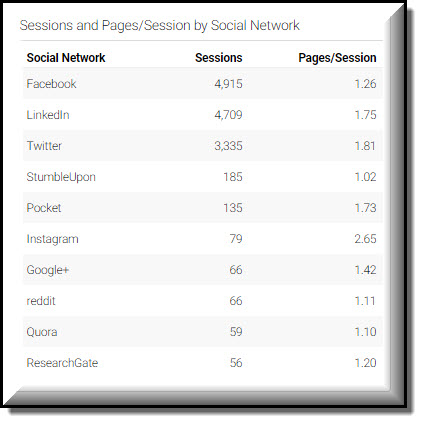
While Facebook and LinkedIn refer far more visitors to our website, it is Instagram that generates the most pages per session. If you get a lot of visits but not many pageviews from a social source, you might want to consider how you can better take advantage of the high referral volume coming your way.
The major social networks are captured here, including LinkedIn, Instagram, Twitter as well as Reddit and Google+ and StumbleUpon.
This is a useful performance measure, as it shows that visitors didn’t just passively leave the page open for an amount of time, or click though to other pages because they were bored, but appreciated your content enough to share it with their contacts.
Look good? Get your own copy of our free Google Analytics Dashboard for you that will help you measure your content effectiveness
5. Who is your audience?
The audience-related widgets on the Google Analytics dashboard give you actionable information about your audience.
The “returning visitors” pie chart gives you an idea of what proportion of your visitors return because they like your brand, and who followed links or found well-optimised content in search engines.
“Visits by weekday” helps you understand when visitors are engaging with your content, so you can publish it or make social manoeuvres at influential times.
Lastly, “visitor location” shows you where in the world your visitors are. You can use this data to inform your content in all kinds of ways, such as:
• Language use
• Cultural concepts
• Competition inclusion areas
Now you know how to measure content effectiveness using real data, you can look at the best and worst performing pages to see what was done differently. Then you can let this inform your content marketing strategy, using what is effective and avoiding what isn’t.
Time to get measuring? Get your own copy of our free Google Analytics Dashboard for you that will help you measure your content effectiveness.