Google Analytics is the industry leader across the web, with 72% of businesses (at time of writing) choosing to use it as their web metrics software. Analytics may be widely installed, but many businesses are failing to take advantage of the information it offers. The main barriers to using Analytics correctly is quite simply lack of skills, lack of resources, as well as just being daunted by the wall of features you can use.
I’m a great believer in taking small steps in order to make big changes, so here are some simple ways that your business can start to use Analytics more effectively. If you need help doing these tasks, then get in touch and a member of our team can help you out.
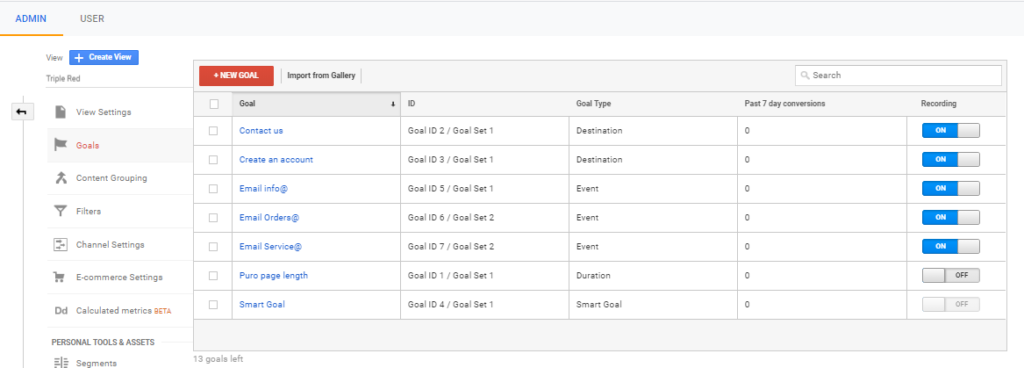
1. Set up your goals
Every website should be built with a purpose, an action you want the user to accomplish on your site. If it’s an e-commerce site, this action is obviously the user purchasing something. But even a brochure site should try to get people to fill in a lead form, download a factsheet or fill out a questionnaire. Tracking these is essential to any successful online marketing activity. It is only through goals that you can accurately measure the success or failure of any particular acquisition channel. Just whatever you do, don’t turn on Smart Goals, they’ll drown you in irrelevant stats.
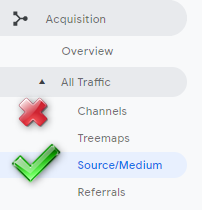
2. Use the “Source/Medium” report over “Channels”
The most common information websites need to know is how many users they’ve had and how they got to the website. For this, the majority of people will use the Channels report. This is because it expresses the acquisition data in an easy language that anyone can understand. However, it is a trap and I would strongly encourage everyone to use the scarier looking Source/Medium report instead. This is because the Source/Medium report is the actual information being fed into GA, whereas Channels is GA’s attempt to understand and parse that information into simpler terms. However, if there’s ever any errors in your tagging or weird quirks of systems, using it can cause unexpected and unrepresentative figures in Channels.
Yes, the Source/Medium report is a tougher report to get your head around and has a tougher learning curve. But the advantage of knowing exactly what information GA has is too much to pass up on. Learn it, use it, improve everything.
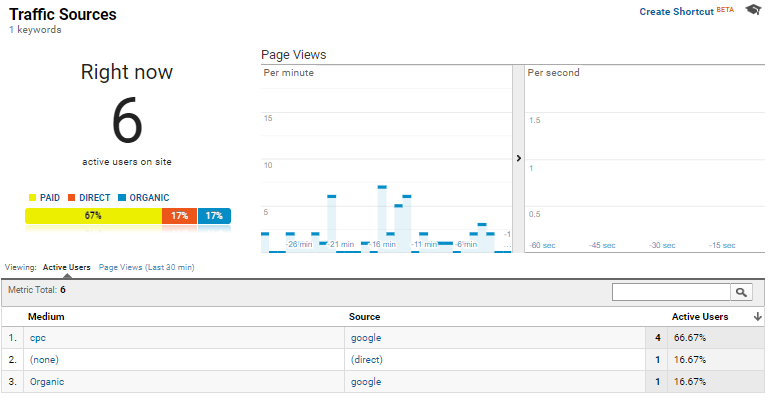
3. Use Real-Time traffic to test tracking & goals
The Real-Time report in GA is chronically under-utilised. That’s predominantly because it’s far more useful to look at an aggregate of users than what any one user is doing right now. However, one of its best uses is to test that Analytics is responding to inputs in an expected way. E.g. You’ve just made a new Goal. Therefore, you go onto your site and do what you think should trigger it, you can then check in the Real-Time report whether that’s come through to Analytics or not.
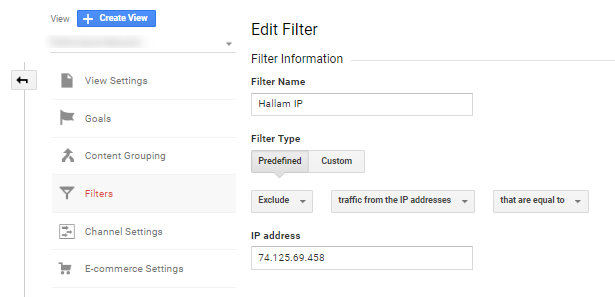
4. Exclude your own traffic
By default, your analytics reports on all users on the site. That’s great, but alas, you visit your own site quite frequently. If you have a fairly low volume website your own visits can warp your stats greatly! Fortunately, you can exclude your IP from Analytics to ensure that only your user’s stats appear in the reports. (N.B. when you want to do the Real Time testing, make sure you temporarily disable this or else you won’t see yourself)
5. Video event tracking
Video plays a significant role in many businesses’ content strategies. You want to be able to report how many people watched and interacted with your video content. Analytics allows you to report events such as pressing the play, pause, and rewind buttons on your video player, as well as recording the time spent interacting. Setting this up is, unfortunately, a little tricky and requires additional tagging on your site either hard-coded or through Google Tag Manager. We’d advise getting some help from your developers if you’re not confident with this.
6. Internal site search
Once a visitor gets to your website, they often can clearly demonstrate what they want by entering a phrase into the search box on your website. Analytics can track these searches, and show you the valuable information of what your visitors are searching for. It will also show you what they did after they searched: how many more pages they looked at, how much longer they stayed on your site, and if they completed any of your all-important goals. You need to turn on the site search tracking, but it doesn’t require any alterations to the tracking code and so is relatively easy to implement following this guide.
7. Secondary dimensions are your friend
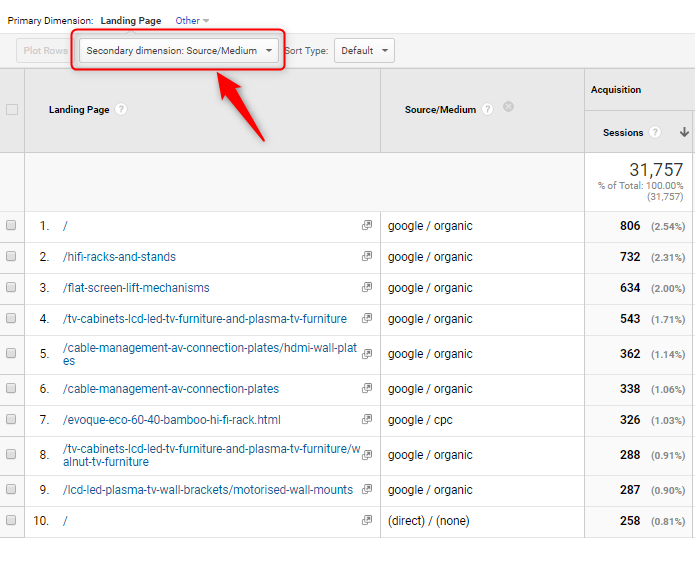
Want to know how much revenue came from each of your versions of the same campaign in Bing & Google? Or what the most common Landing & Exit Page combinations are? Most types of advanced analysis usually involve the intersection of two Dimensions. This is where the handy little secondary dimension button comes in. Don’t forget to filter down to only the dimensions you care about though! Here are three ways you can use secondary dimensions.
8. Use UTM tags in your social activity
Your digital marketing campaign will include a range of activities: email marketing, placing links on other websites, paid & organic social posts. You can customise these links to contain additional campaign information so that you can measure which activities are worthwhile and generating good results for you. For example, if you post an update to a particular Facebook or LinkedIn group, then by using a specific campaign URL your analytics will help you to understand which audiences respond to your content the most. This can also be where the source/medium knowledge can come in handy as you can separate out your paid & organic social traffic with this method. You can use this campaign URL builder to create UTM tags.
9. Cross-domain tracking
Many businesses have content spread across multiple domains and subdomains: you have your own website, maybe your blog on a subdomain, and maybe a PPC landing page using a service like Unbounce. Your analytics can track across multiple domains. This does require a slight tweak to the tracking code on said sites as well as a couple of changes within Analytics itself. This Google help page should hold all the information you’ll need to implement this.
10. Exporting to Google Sheets is big and smart
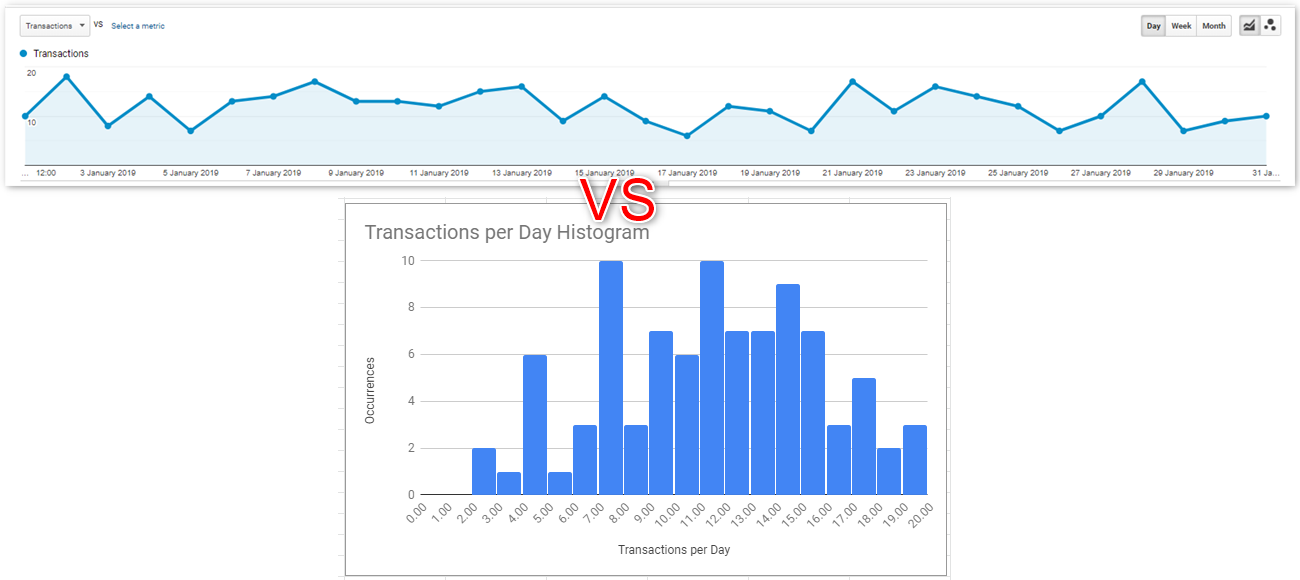
There’s sometimes just no substitute for getting a ton of raw data out from GA and running a nice Pivot Table or creating a chart from it. This is also a great way to get your charts to look nice and on brand rather than being obvious GA screenshots which are often in an unfriendly format.
To do this there’s usually an export button in the top right-hand corner. For some reports, you’ll need to make a custom report instead to get an export button, but it’s usually worth the effort to be able to get the data in such a versatile format.
I’ve rattled through a bunch of techniques in this blog, some of which can be a little tricky to embed in your processes.


