
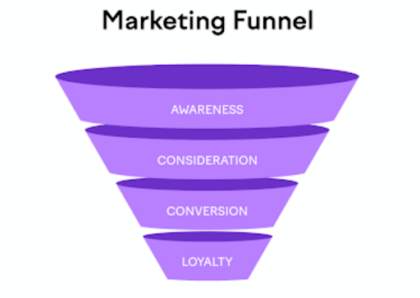
Attribution in 2010 was simple, a user clicked on an ad and that ad was attributed to the sale. To account for the rising complexities and various ad channels we use now, the marketing funnel was created.
But many of us know that it still can’t account for all the marketing channels and factors influencing a purchase decision today.
Often, last click attribution will attribute the final ad clicked as the reason for purchase so it can be hard to measure the return on investment (ROI) of upper-funnel activity despite us knowing from our own personal experience as buyers that brand awareness activity is certainly necessary.
Now, with the introduction of increased GDPR legislation and cookie banners, measurement has just become even more complex.
What are the options?
Attribution is an excellent tactical tool, but not great for strategy and while econometrics is great at strategy, it’s often expensive and slow.
Setting up a simple, top-level measurement framework will keep your finger on the pulse at all times.
What does a good measurement framework look like?
A good framework consists of a set of KPIs that summarise the general performance of a business.
You only need to measure 4-6 metrics to have a clear grasp of what channels are working and notice which issues need fixing.
To determine what these metrics should be, think about what you are trying to achieve. Usually the answer is one of the following:
- Increased brand awareness
- More interest in products
- More products sold
- Better long-term retention
We’d recommend that a standard framework measuring these goals should consist of the below metrics:
- Own-brand searches
- Non-homepage traffic
- Engaged sessions
- Conversions/modelled revenue
- Ad spend/marketing spend
- Conversion rate (if working on conversion rate optimisation)
How to use the framework
The key factor to focus on is the change. If there were 20.5k visits on your site last month, then how does it compare to previous periods? Have website visits dropped by 60% last month compared to the previous month?
By measuring the change, you can clearly see which issues need attention.
What’s the conclusion for these examples?
- Own-brand searches ↓ – We’re spending more money
- Non-homepage traffic ↑ – We’re getting less sales back
- Engaged sessions ↑ but getting more traffic on site
- Conversions/modelled revenue↓ – Only thing that’s negative is our
- Ad spend/marketing spend↓ brand metric
- Conclusion: over-investment in bottom of funnel marketing activity
- Action: shift budget/emphasis to top of funnel activity
How about now?
- Own-brand searches ↑ – We’re spending more money
- Non-homepage traffic ↑ – We’re getting less sales back
- Engaged sessions ↑ but getting more traffic on site
- Conversions/modelled revenue ↓ – Brand is doing excellently!
- Ad spend/marketing spend ↑
- Conclusion: issue on website causing users to not convert
- Action: Look into conversion rate optimisation and/or pricing issues
Always remember there can be a lag time – sometimes significant amounts – so don’t act too rashly.
Takeaways
- In 2024 you can’t rely on digital attribution for your strategic decision making.
- A few well chosen KPIs beat a wall of metrics.
- Make sure you’re covering the whole funnel.
- Look at longer time frames to gain context.
- Make decisions and test things.
- Remember the chance of lag time.
Want a chat with one of data and insights specialists for advice around enhancing the effectiveness of your measurement framework? Get in touch.